Notice
is given that an ordinary meeting of the Strategy Finance and Performance
Committee will be held on:
|
Date:
Time:
Meeting
Room:
Venue:
YouTube Link
|
Thursday 19 March 2026
9.30am
Tasman Council Chamber
189 Queen Street, Richmond
Tasman District Council - YouTube
|
|
Strategy
Finance and Performance Committee
Komiti
Rautaki me te Kaupapahere
AGENDA
|
MEMBERSHIP
|
Chairperson
|
Cr K Maling
|
|
|
Deputy
Chairperson
|
Cr D Woods
|
|
|
Members
|
Mayor T King
|
Cr M
Kininmonth
|
|
|
Cr C Butler
|
Deputy Mayor B
Maru
|
|
|
Cr J Ellis
|
Cr D McNamara
|
|
|
Cr K
Ferneyhough
|
Cr P Morgan
|
|
|
Cr M Greening
|
Cr T Neubauer
|
|
|
Cr J Gully
|
Cr T Walker
|
|
|
Cr M Hume
|
|
|
(Quorum 8 members)
|
|
Contact Telephone: 03 543 8400
Email: tdc.governance@tasman.govt.nz
Website:
www.tasman.govt.nz
|
Strategy Finance and
Performance Committee Agenda – 19 March 2026
AGENDA
1 Opening, Welcome, KARAKIA
2 Apologies
and Leave of Absence
|
Recommendation
That the apology
from Councillor D Woods be accepted.
|
3 Public
Forum
Nil
4 Declarations
of Interest
5 LATE
ITEMS
6 Confirmation
of minutes
|
That the minutes of
the Strategy Finance and Performance Committee meeting held on Thursday, 19
February 2026, be confirmed as a true and correct record of the meeting.
|
|
That the confidential
minutes of the Strategy Finance and Performance Committee meeting held on
Thursday, 19 February 2026, be confirmed as a true and correct record of the
meeting.
|
7 Reports
7.1 Presentation by Mr Tim Cadogan from Taumata
Arowai........................................ 4
7.2 Financial Report....................................................................................................... 5
7.3 Long-Term Plan Assumption - Population
Projection........................................... 17
7.4 Adoption of Tasman Inundation Practice Note...................................................... 64
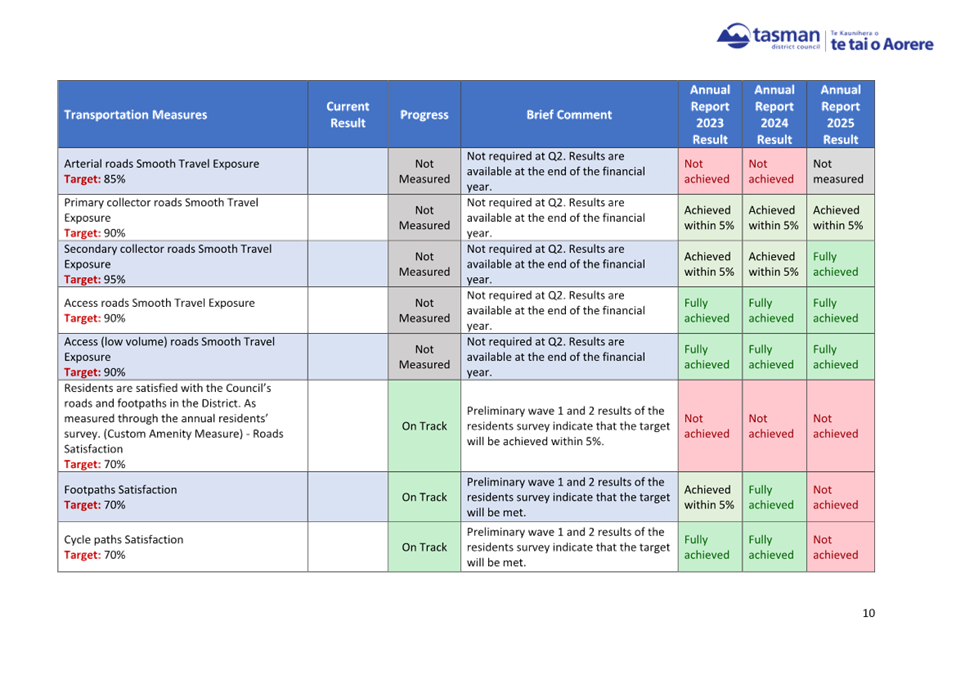
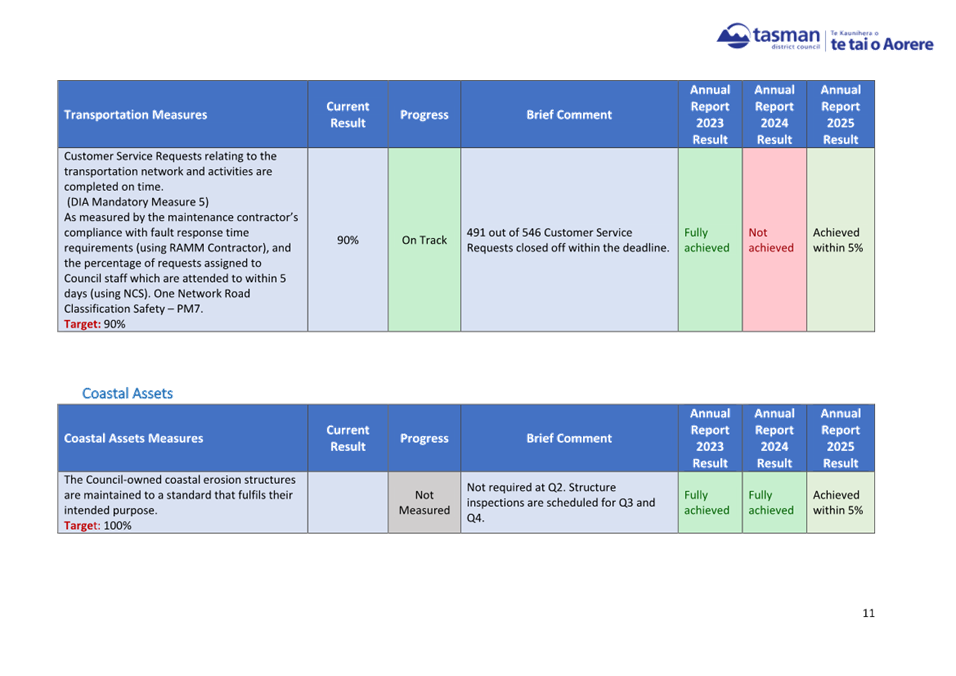
7.5 Six-Month Performance Measure Progress
Report 2025/2026.......................... 132
7.6 Chair's Report...................................................................................................... 163
8 Confidential
Session
8.1 Procedural
motion to exclude the public............................................................. 165
8.2 Community Occupancy Policy - Financial
implications....................................... 165
9 CLOSING
KARAKIA
Strategy Finance and
Performance Committee Agenda – 19 March 2026
7 Reports
7.1
Presentation by Mr
Tim Cadogan from Taumata Arowai
|
Report
To:
|
Strategy
Finance and Performance Committee
|
|
Meeting
Date:
|
19
March 2026
|
|
Report
Number:
|
RSFP26-03-5
|
1. Presentation
/ Whakatakotoranga
Mr Tim Cadogan from Taumata Arowai will
make a presentation to the Strategy Finance and Performance Committee on Water
101. Mr Cadogan is the Engagement Specialist with
Taumata Arowai and a former Mayor of Central Otago District Council.
He has been presenting “Water
101” to several councils throughout New Zealand.
Nil
Strategy Finance and
Performance Committee Agenda – 19 March 2026
7.2 Financial Report
Information Only - No Decision
Required
|
Report
To:
|
Strategy
Finance and Performance Committee
|
|
Meeting
Date:
|
19
March 2026
|
|
Report
Author:
|
Paul
Egan, Management Accounting Manager
|
|
Report
Authorisers:
|
Sue
McLean, Group Manager - Strategy & Finance; Matthew McGlinchey, Financial
Strategy & Planning Manager
|
|
Report
Number:
|
RSFP26-03-6
|
1. Summary
/ Te Tuhinga Whakarāpoto
1.1 This
report provides an update on key financial results for the seven months ended
31 January 2026.
1.2 The
report also outlines recent trends in the balanced budget benchmark, capital
expenditure, and maintenance expenditure.
1.3 Section
9 responds to questions raised in the equivalent report considered on 19
February 2026. Staff remain open to making further refinements where possible,
noting that system limitations may restrict some changes.
1.4 Overall,
financial results continue to track consistently with the position reported to
the Committee at its meeting on 19 February 2026.
1.5 Key
point updates are summarised below:
1.5.1 Severe weather events continue to have a material impact on
the Council’s financial position. As at 31 January 2026, operating
expenditure related to these events totalled $25.3 million, of which $23.0
million has been classified as maintenance. This excludes staff time. A
separate report is being prepared for the Information‑Only Council
meeting on 28 April 2026, which will provide an update on the emergency events,
including financial and insurance matters.
1.5.2 Net debt has increased $23.8 million since 30 June 2025,
largely reflecting expenditure associated with the severe weather events.
1.5.3 Capital expenditure year to date is $29.7 million,
representing 31% of budget.
1.5.4 Additional maintenance and operations costs are expected in the
Three Waters activities. This has previously been reported to the
Information Forum of 11 February 2026, with further reporting on
reactive maintenance and renewals scheduled for the Full Council meeting on 7
May 2026.
1.5.5 The balanced budget benchmark was 89.6% as at 31 January
2026, compared with a budgeted position of 94.72%.
1.5.6 No material insurance recoveries, relating to the emergency
event, had been recognised as income as at 31 January 2026.
2. Recommendation/s
/ Ngā Tūtohunga
That the Strategy
Finance and Performance Committee
1. receives the Financial Report Year to Date January 2026 report RSFP26-03-6.
3. Balanced
Budget Benchmark
3.1 The
balanced budget benchmark is a prescribed measure used to assess the operating
performance of local authorities. It is used in preference to a traditional
“profit and loss” measure because local government financial
statements include a range of revenue items that are capital, one‑off, or
non‑controllable in nature, which can obscure the Council’s
underlying operating position.
3.2 The
benchmark forms part of the suite of prudence measures set out in the Local
Government (Financial Reporting and Prudence) Regulations 2014 and is reported
alongside other benchmarks in the Council’s statutory planning and
reporting documents. Consistent with the Council’s Financial Strategy,
the benchmark is intended to be considered over the medium to long term, rather
than as a point‑in‑time target, acknowledging that temporary
deviations may occur due to timing effects, significant capital programmes, or
exceptional events
3.3 The
benchmark indicates the extent to which operating expenditure is funded
from operating revenue after excluding items that do not relate to core
operations, such as development contributions and revaluation movements. It
should be read in conjunction with the full financial results, cashflow
position, and debt measures to provide a balanced view of the Council’s
financial sustainability.
Chart 1 | YTD Balanced Budget
Benchmark
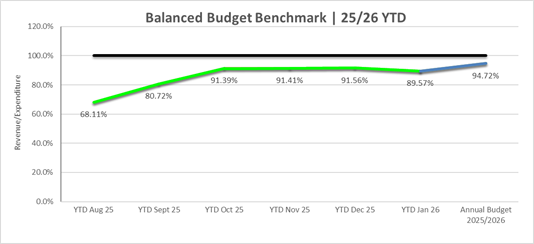
3.4 The
year‑to‑date balanced budget benchmark is 89.57%, representing a
slight decline from the position reported previously.
3.5 The balanced
budget benchmark has been below 100% in several recent years. In some years,
this position is also budgeted, reflecting deliberate funding decisions that
are consistent with the Council’s Financial Strategy. These include
instances where operating expenditure is funded from sources other than
operating revenue, such as:
3.5.1 Loan funded Operating Expenses, primarily related to:
· Contributions
to assets of Saxton Fields facilities, where the asset is constructed on land
owned by Nelson City Council and recorded as an asset of Nelson City
Council. While the expenditure contributes to long‑lived assets,
the accounting treatment for Tasman District Council is as a grant or
contribution, as the Council does not own the assets.
· Expenditure
on the Tasman District Council Digital Innovation Programme, which is largely
classified as operating expenditure due to cloud‑based accounting
treatment requirements
· Expenditure
on the Tasman Resource Management Plan.
· A grant
contribution towards the new ARC facility
· Decisions to
not fully fund depreciation in a given year, consistent with adopted funding
and affordability settings
3.5.2 The
use of Reserves, representing surplus funds carried forward from prior years to
be used on expenditure in the current year.
3.6 To
provide context and illustrate recent trends, the chart below presents the
balanced budget benchmark as reported in the most recent Annual Report, updated
to include year‑to‑date actuals and the current year budget.
3.7 The
chart is presented on a consolidated basis and includes year‑end
adjustments relating to the Council’s share of joint ventures and joint
operations up to 24/25.
Chart 2 |
Balanced Budget Benchmark – Comparison to Prior Years
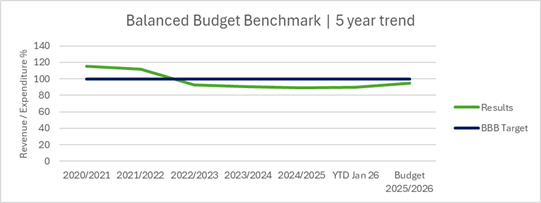
3.8 The Council’s
year‑to‑date balanced budget benchmark is a provisional position
and does not include year‑end adjustments associated with joint ventures
and joint operations. In the previous two financial years, the inclusion of
these adjustments at year end did not result in a material change to the
benchmark outcome.
3.9 The most
likely factor that may improve the final year‑end benchmark position is
the reclassification of certain unplanned repair expenditure arising from
severe weather events to unplanned capital expenditure, following the
completion of impairment testing. Any such adjustments will be reflected in the
year‑end financial statements.
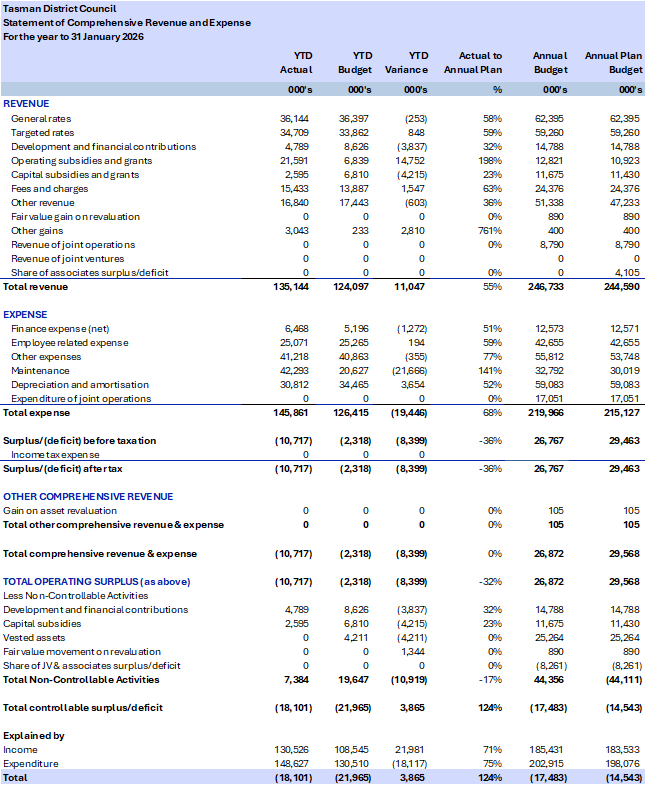
4.1 Table 1 | Statement of
Comprehensive Revenue and Expense
Development and financial contributions
4.2 Development
and financial contributions, which largely support future growth, continue to
track below the year‑to‑date (YTD) budget by $3.8 million. This
variance reflects the impact of current economic conditions on development
activity.
Operating subsidies and grants
4.3 Operating
subsidies and grants are $14.8 million above the YTD budget and exceed the
full-year budget of $6.8 million. This increase is primarily driven by
additional funding from government agencies, including Waka Kotahi, MBIE, and
MfE, largely in response to the severe weather events. The majority of this
variance reflects accounting accruals rather than cash received to date.
Capital Subsidies
4.4 Capital
subsidies are $4.2 million below the YTD budget. This variance reflects delays
in MBIE-funded Lower Motueka River works and disruptions to planned roading
projects, and thus the Waka Kotahi subsidy, caused by weather events.
Fees and charges
4.5 Fees
and charges are tracking at 63% of the annual budget at $1.5 million ahead of
YTD budget. This is driven by Resource Consents, Solid Waste and Industrial
water supply exceeding budget. There are also timing impacts from areas
where there are annual charges that have been billed for the year in
Environmental Services.
4.6 While
some areas are tracking above YTD budget, many have a seasonal or annual aspect
to their income, and it cannot be assumed that this favourable variance will
continue to grow.
Other Gains
4.7 Other
gains relate to the sale of ETS credits ($3.0 million), approved by the Council
after the adoption of the annual plan 2025/2026.
Finance Expense (net)
4.8 Net
finance expenses are at 51% of full year budget at 58.3% of the way through the
year. Some joint venture related interest costs are expected and budgeted at
end of financial year.
Employee related expense
4.9 Employee
costs are aligned with budget expectations as at 31 January 2026. Senior
management continue to actively manage staffing levels and the timing of
vacancy appointments.
Maintenance expense
4.10 For
reporting clarity, this report separates routine operational maintenance from
emergency event‑related costs (refer Table 2).
4.11 Emergency maintenance expenditure to date totals $23.0 million. The
externally funded component of this expenditure is still being finalised, as
confirmation of amounts is taking time, particularly where multiple external
funders are contributing to the same affected assets. In the interim, the
unfunded balance is being financed through debt. Net recovery of these costs is
planned through the proposed recovery rate.
4.12 Excluding
weather-related activity, maintenance expenditure remains below budget and is
expected to continue to do so. Water Supply and Wastewater activities, however,
continue to experience elevated reactive maintenance costs and are forecast to
exceed their respective budgets. Reactive
maintenance budgets have been increased in the 2026/2027 draft Annual Plan to
maintain asset value and service performance.
4.13 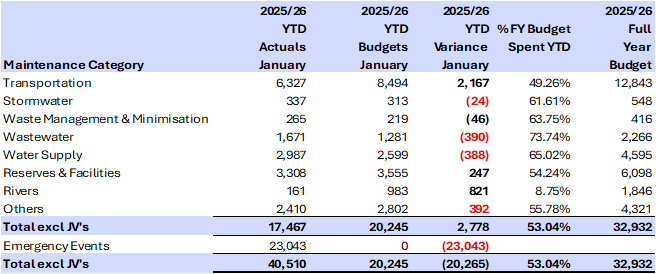 Table 2 | Maintenance Expenses
5.1 The
capital works programme is developed using a planning assumption that, on
average, around 10% of approved capital projects are not fully delivered within
a financial year. This reflects the inherent uncertainty in large and complex
capital programmes, including consent timing, procurement, weather, and
external dependencies. This assumption reduces the level of forecast borrowing
required and, in turn, limits debt servicing costs and the need to set rates to
fund borrowing that may not ultimately be drawn
5.2 Year‑to‑date capital expenditure totals $29.7
million against a planned budget of $95.6 million, representing 31% of the full‑year
budget. As part of normal capital programme management, staff are reviewing
project sequencing and priorities within the current year programme to develop
a refined reforecast and a more accurate spend profile. In parallel, a
technical review of emergency‑related expenditure is underway, which may
result in some costs currently recorded as maintenance being reclassified as
capital expenditure following impairment assessment. Any updated forecasts will
be reported to the Committee in a future financial update
5.3 A summary of the budget, actual spend by
activity is provided in Table 3.
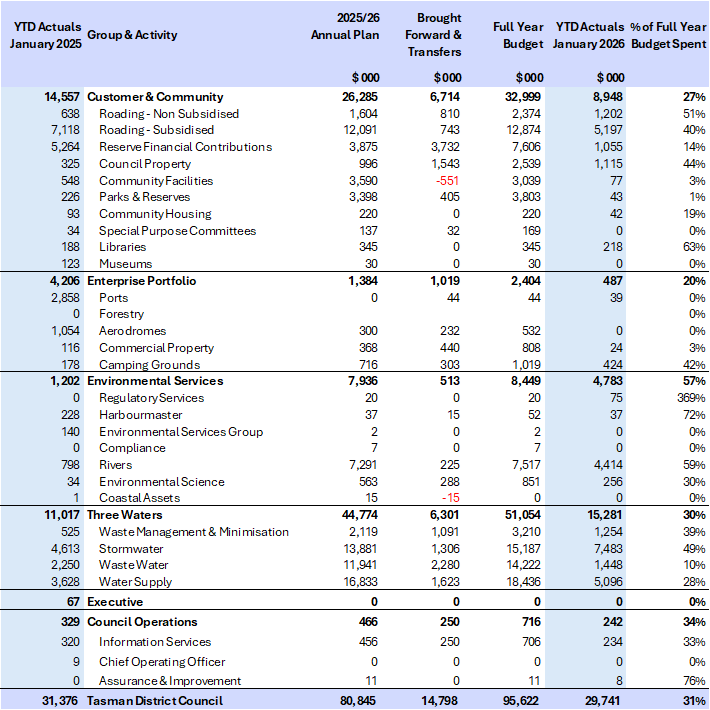 Table 3 | Capital Expenditure
5.4 The following chart provides context on
how capital programme delivery typically profiles through the financial year
and how the Council actively manages delivery, borrowing, and affordability
risks.
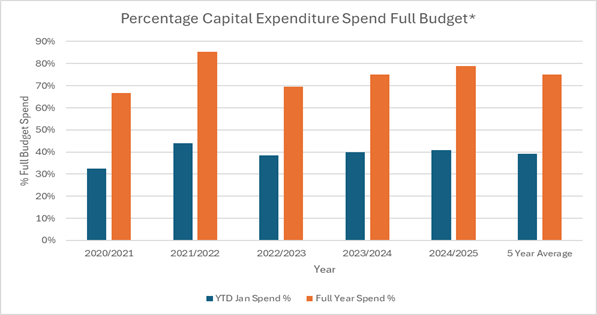 Chart 4 | Historical Capital Expenditure
Trend (Excluding JV’s)
Chart 4 | Historical Capital Expenditure
Trend (Excluding JV’s)
* Note:
“Full Budget” refers to the Annual Plan budget, including approved
carry‑forwards and any additional amounts or changes approved by Council
during the financial year.
5.5 Over
the five‑year period shown in the chart above, the average proportion of
the full capital budget delivered within each financial year is approximately
75%. The remaining ~25% is predominantly timing-related underspend that
is carried forward into the next financial year as approved carry-forwards to
complete the same projects.
5.6 A summary of capital programme
management is outlined below.
5.6.1 As at 31
January 2026, capital expenditure represents 31% of the full‑year
programme. This result reflects both the timing of project delivery and
the concentration of expenditure later in the financial year for a number of
large projects, rather than a uniform slowdown across the programme.
5.6.2 While the programme’s unconstrained technical
forecast indicates a potential year‑end spend of $83.6 million against a
full‑year budget of $95.6 million, the Executive Leadership Team has
endorsed a reduced working capital delivery envelope of $70 million for the
current year. This envelope reflects assessed deliverability and will be used
as the basis for programme prioritisation, borrowing assumptions, and financial
management.
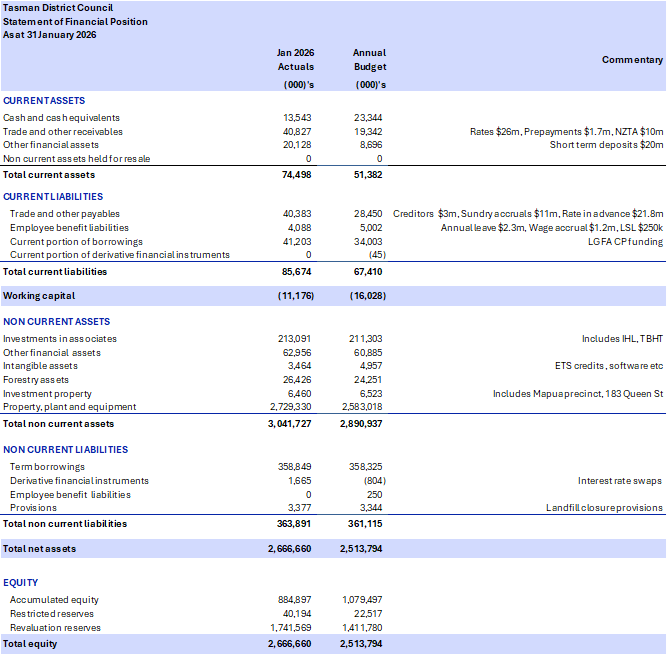
6. Statement of Financial Position (Balance Sheet)
6.1 Table 4 | Statement of Financial Position
6.2 Trade and other
receivables are higher at 31 January 2026 predominantly due to the timing of
quarterly rates billing.
7. Net Debt and External Debt
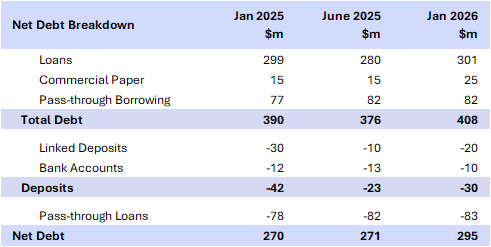
 7.1 As at 31 January 2026, the
Council’s total debt was $408.0 million, compared with $376.4 million at
30 June 2025. Net debt was $295.0 million, up from $271.3 million at 30 June
2025. This remains below the net debt level of $305 million projected in the
2025/26 Annual Plan.
7.1 As at 31 January 2026, the
Council’s total debt was $408.0 million, compared with $376.4 million at
30 June 2025. Net debt was $295.0 million, up from $271.3 million at 30 June
2025. This remains below the net debt level of $305 million projected in the
2025/26 Annual Plan.
7.2 Pass‑through
loans relate to shareholder advances to Waimea Water Limited to fund the Waimea
Community Dam. These loans are excluded from the Council’s net debt
calculation, as the associated cashflows are passed through to the Council‑controlled
entity. However, they are included when assessing the Council’s total
borrowings from the Local Government Funding Agency (LGFA) and compliance with
LGFA covenants.
7.3 Commercial
paper is a short‑term funding tool used to manage liquidity and timing
differences within the financial year. The use of commercial
paper is consistent with the Council’s Treasury Management Policy and
supports prudent cashflow and debt management without increasing long‑term
debt commitments.
7.4 Linked
deposits reflect the pre‑funding of the Council’s April 2026 LGFA
loan repayments and form part of the Council’s approved treasury
management strategy. These deposits temporarily increase gross debt but reduce
refinancing risk and support liquidity management.
7.5 Table
5 below provides a breakdown of net debt, including the impact of pass‑through
loans and linked deposits.
Table 5 | Net
debt breakdown
8.1 Rates receivables are consistent
with the same period in the 2024/2025 year after accounting for rates income
increases. The balance primarily reflects the timing of this report. Other
receivables are higher than the prior year, largely due to the recognition
of subsidy and grant income related to recent weather events.
8.2 The receivables
summary is set out below:
Table 6 |
Debtors / Receivables
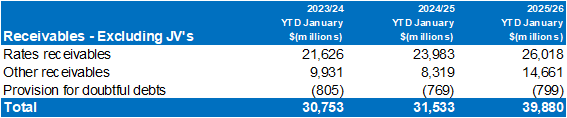
8.3 As noted earlier
in the report the timing of the quarterly rates billing leads to a larger rates
receivable in January. Other receivables includes $9.1 million of Waka
Kotahi weather event related funding that has been agreed.
9. Councillor Queries at 19th February
Equivalent Report
9.1 At the meeting held on 19 February, councillors raised a
number of questions and requests for further information. Staff undertook to
consider these matters and report back where practicable. This section provides
an update on those items.
9.2 Some requests are constrained by the capability of the
Council’s current financial system, which has been in place since the
1990s. While the Modern Finance programme is intended to address these
limitations, the transition to a new system is complex, costly and will take
time. Certain information cannot currently be produced due to the structure of
the general ledger and the way the system (MagiQ Enterprise) captures and
records data.
9.3 The following actions have been
completed in response to councillor queries:
9.3.1 A
historic year‑to‑date capital expenditure comparison for the same
period in the previous financial year has been included.
9.3.2 We have added a five-year capital expenditure graph that
shows where the current year compares with previous years spend.
9.3.3 Development
contributions have been clarified. Contributions are payable once a Section 222
certificate is issued and ultimately fund capital expenditure. At present,
receipts are primarily used to reduce development‑related debt, as the
development contribution balance is in deficit due to the pace of growth in the
district. By the end of 2033/34, development‑related debt is expected to
exceed $100 million. This debt is forecast to be repaid over time as
development contributions are collected, reflecting the Council’s growth
profile.
9.3.4 The councillors are provided financial results regularly
through the Strategy, Finance and Performance Committee. This is where
monthly financial results are best sourced.
9.3.5 A question was asked around lower development contributions this
year and how that impacts future years. Lower development contribution
revenue in the current year will be reflected in updated budget projections and
considered as part of future planning cycles.
9.4 Other
requests cannot currently be progressed without significant changes to the
general ledger structure or the implementation of an enhanced financial system
or are simply not appropriate.
9.4.1 A request for cost and revenue reporting by ward, community,
or neighbourhood cannot be supported at this time. Even with a modernised
system, allocating costs at this level would be complex and would require
careful consideration as part of any future system design
9.4.2 It was suggested that known future commitments be
incorporated into the net debt cap calculation. Net debt is a point‑in‑time
measure reflecting the Council’s cash position. Including commitments
without also including known future income would not provide a balanced or
meaningful measure. The new debt calculation in the Annual Plan is intended to
act as a proxy for these future inflows and outflows, including commitments.
9.4.3 For similar reasons, net debt calculations are not produced
on a monthly basis. Operating revenue is received unevenly throughout the year,
and the information required to calculate the dynamic net debt cap is most
appropriately assessed at year end.
9.4.4 A
request was made to provide the Net Debt Headroom with regard to the both the
Treasury policy limit of a dynamic 160% and the LGFA requirements for the
current year. This ratio is calculated on a full revenue figure. We do not have
this till year end so the ratio or graph presented would be meaningless if
calculated during the year.
Nil
Strategy Finance and
Performance Committee Agenda – 19 March 2026
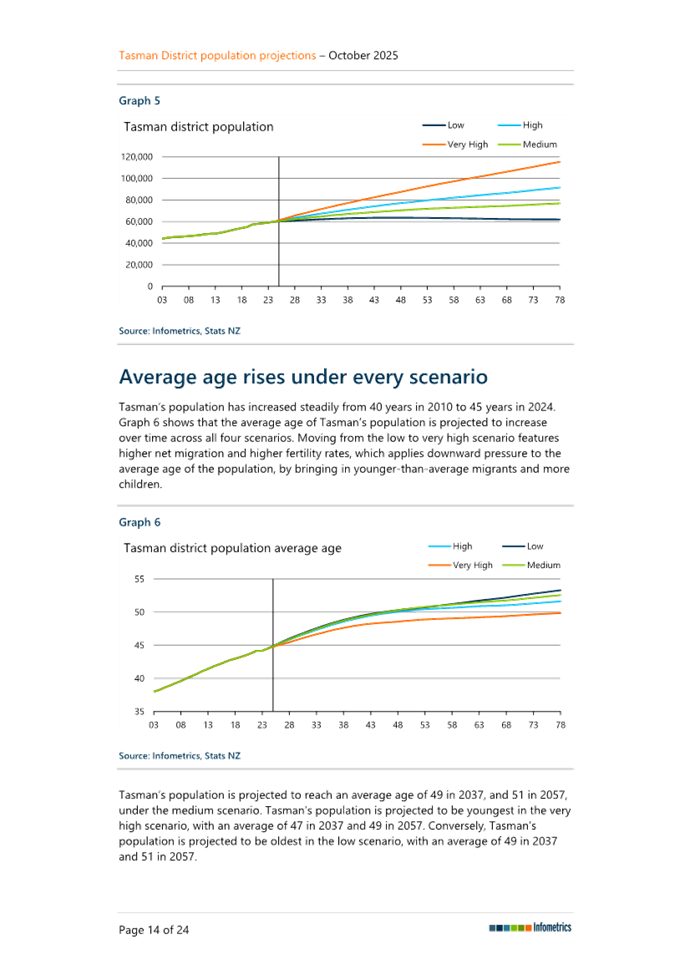
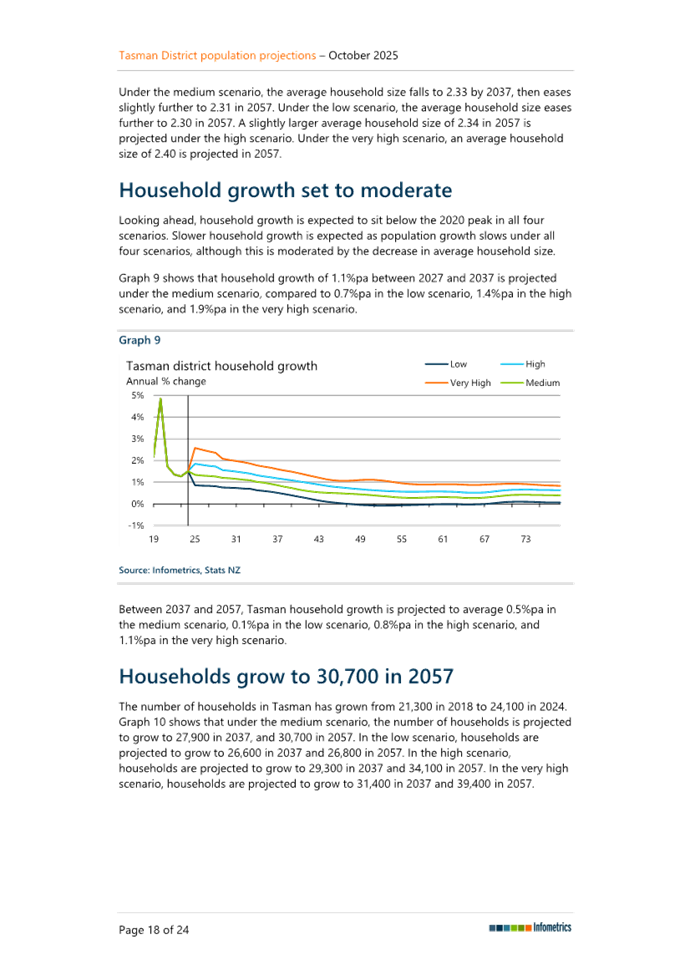
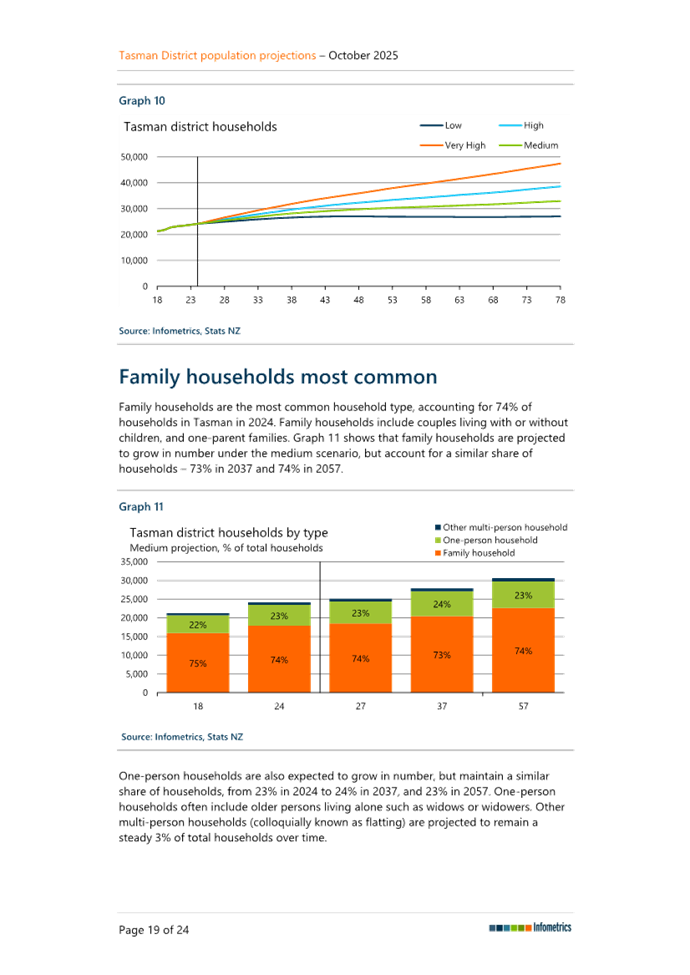
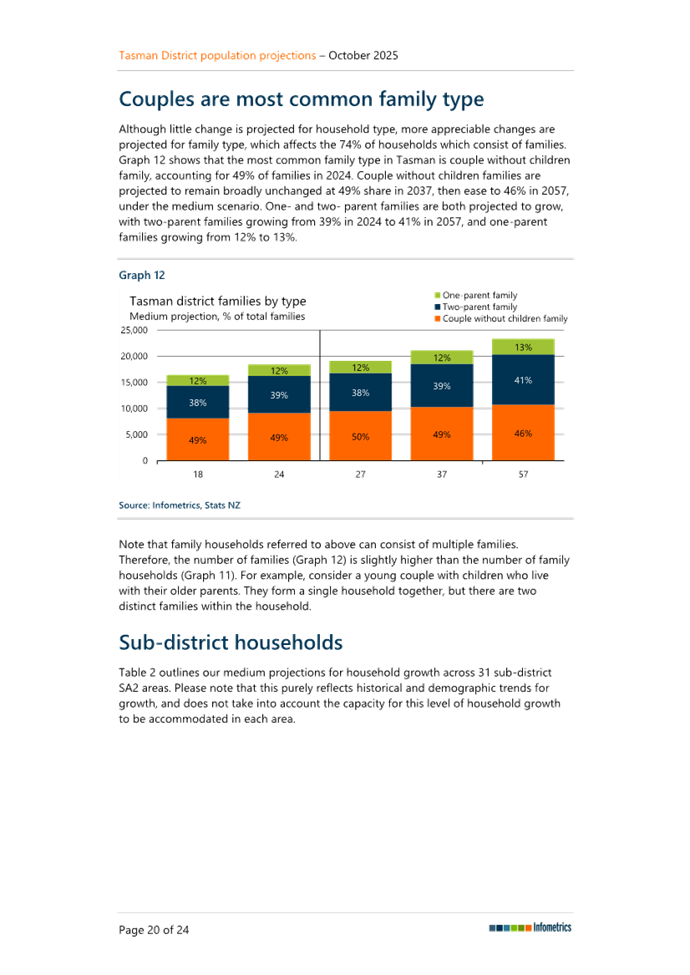
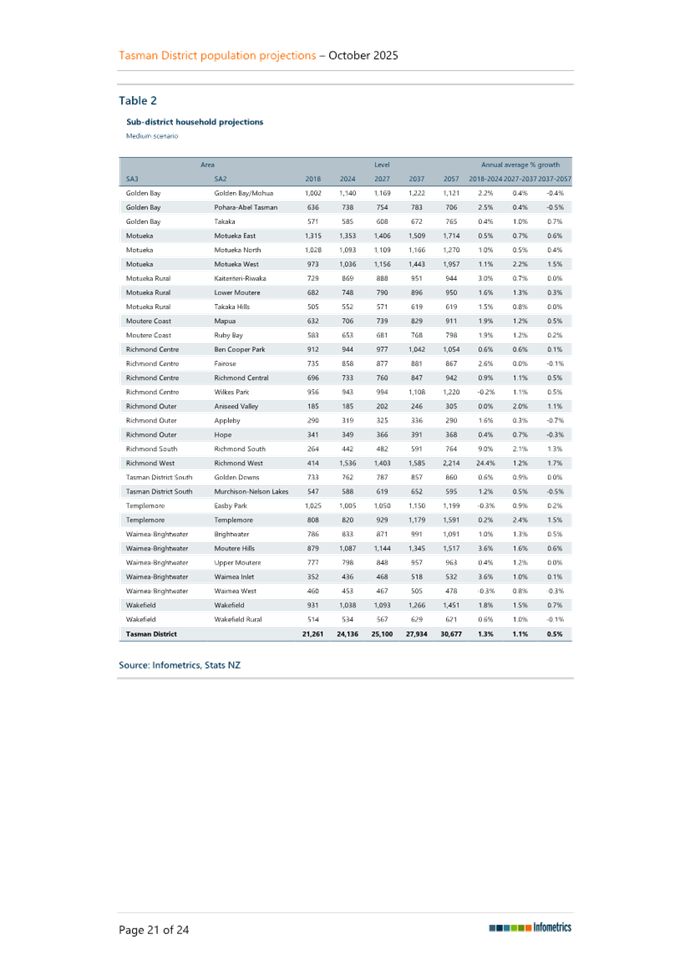
7.3 Long-Term Plan Assumption - Population
Projection
Decision Required
|
Report
To:
|
Strategy
Finance and Performance Committee
|
|
Meeting
Date:
|
19
March 2026
|
|
Report
Author:
|
Geoff
Everitt, Senior Policy Advisor – Data Analysis
|
|
Report
Authorisers:
|
Sue
McLean, Kaiwhakahaere ā Rōpū – Te Pae Rautaki Ahumoni |
Group Manager - Strategy & Finance
|
|
Report
Number:
|
RSFP26-03-4
|
1. Purpose
of the Report / Te Take mō te Pūrongo
1.1 Staff
seek approval of the population growth assumption for the Long-Term Plan (LTP)
2027-2037.
1.2 The
decision sought now is for the Committee to approve the population growth
assumption (High) that will be used to anchor the Growth Model update and
Long-Term Plan 2027–2037.
2. Summary
/ Te Tuhinga Whakarāpoto
2.1 Staff
recommend adopting the High population growth scenario to guide the Growth
Model update and Long-Term Plan 2027–2037, as it provides a more cautious
basis for identifying potential long‑term infrastructure, regulatory, and
land‑supply risks.
2.2 The
High scenario is expected to provide a more risk‑aware planning
foundation if higher growth occurs.
2.3 The
executive leadership team (ELT) endorsed the use of the High projection on 17
February 2026, following consideration of a memo presented to it.
3. Recommendation/s
/ Ngā Tūtohunga
That the
Strategy Finance and Performance Committee
1. receives
the Long-Term Plan Assumption - Population Projection RSFP26-03-4; and
2. approves the high population assumption as the basis
for the growth model and related planning in the Long-Term Plan 2027-2037.
4.1 A
population assumption is required so staff can complete the Growth Model update
and ensure supply and demand modelling is ready to inform subsequent LTP
workstreams, including infrastructure, land‑use, and financial planning.
Timely endorsement is essential
to keep Growth Model outputs on schedule for May 2026, allowing them to feed
into wider LTP development without delay.
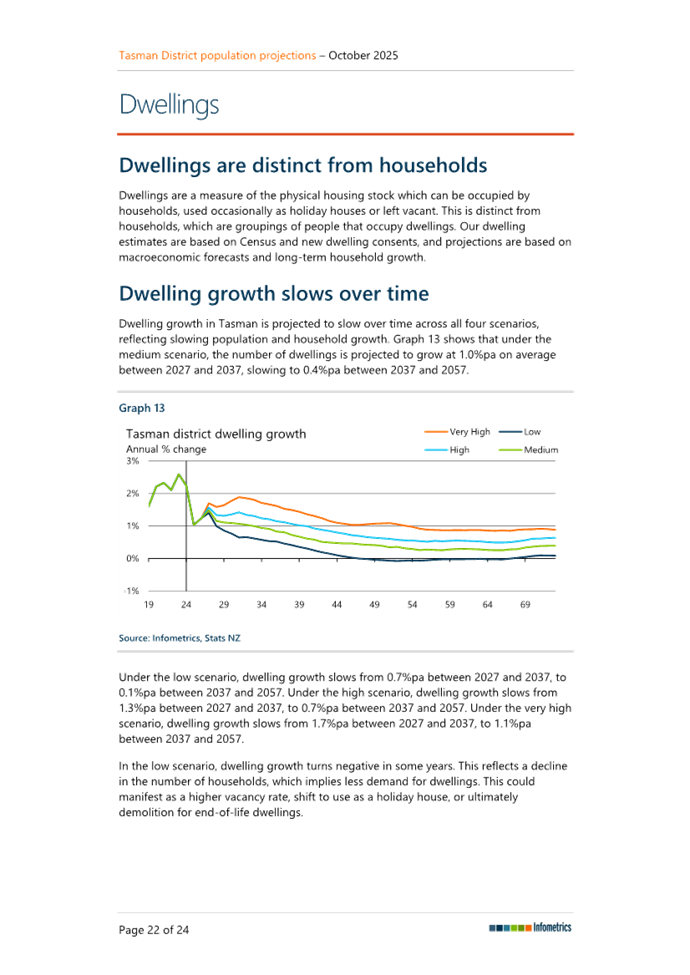
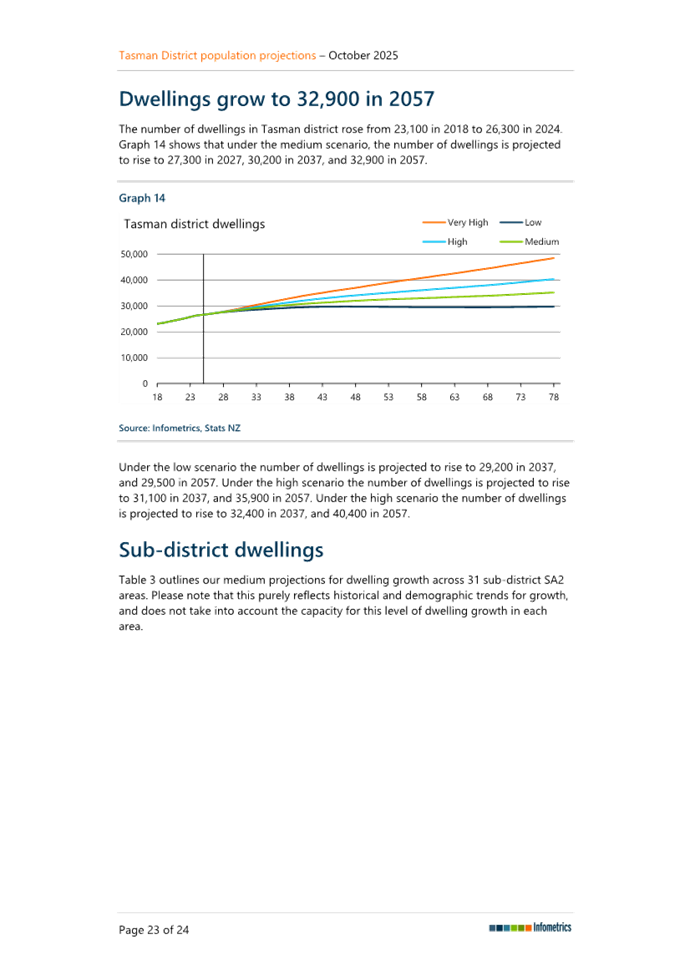
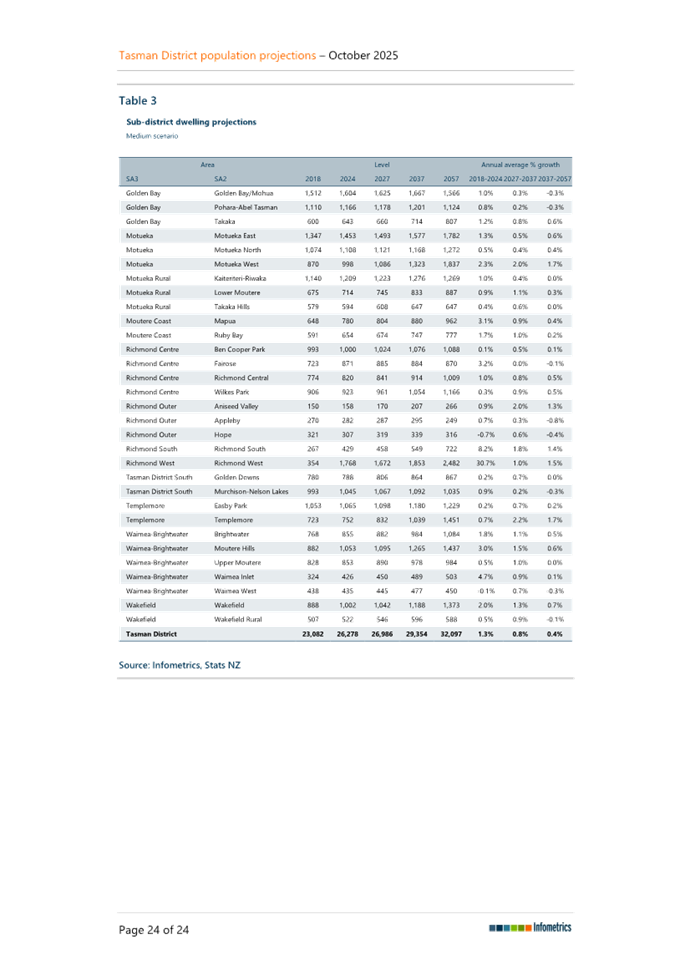
5. Analysis
and Advice / Tātaritanga me ngā tohutohu
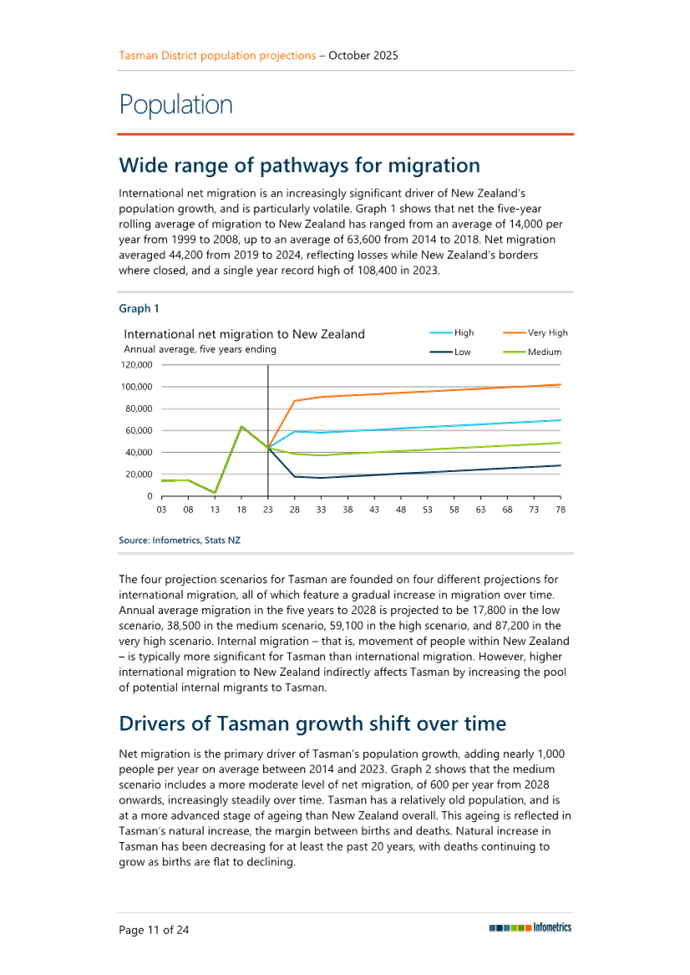
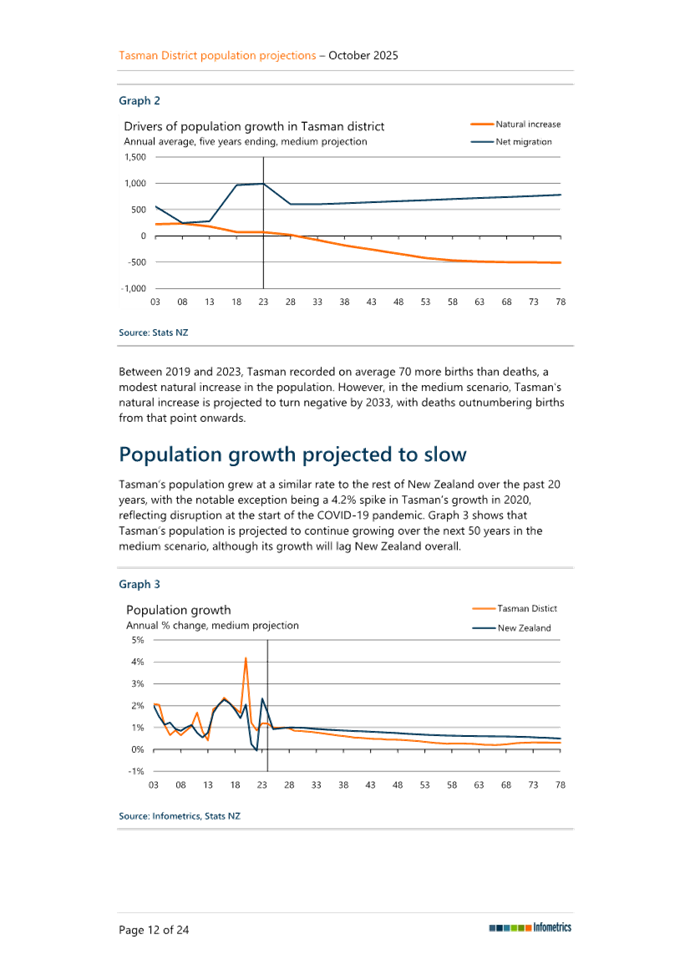
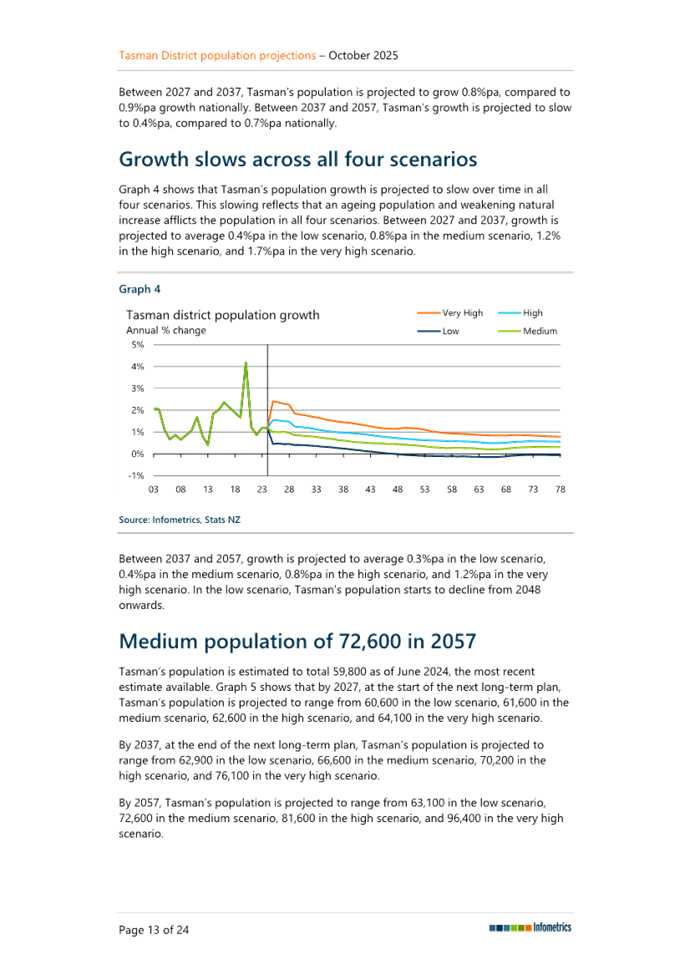
5.1 For
LTP purposes, analysis has focused on the Medium, High, and Hybrid population
scenarios. All three track similarly in the early years; however, by 2037 the
difference between Medium and High is approximately 900 dwellings and 3,600
residents, widening further over the longer term. The Hybrid scenario sits
between the two.
5.2 The
High scenario aligns with the assumption used in the previous LTP. Although
growth has slowed recently, reflected in the decline in building consent
applications, long‑term trends, including historic population
variability, have more closely tracked the High projection. The Hybrid scenario
reflects current short‑term slowdown more directly but introduces
additional modelling complexity.
5.3 The
demographer advised that growth is statistically most likely to follow the
Medium projection but noted that planning decisions should incorporate wider
policy and infrastructure considerations. Historically, national projections
have tended to be too conservative (i.e. underestimated growth).
5.4 Tasman
has experienced large year‑to‑year swings in both dwelling and
population growth, with periods of rapid increase followed by sharp slowdowns.
Because of this volatility, short‑term movements may give only limited
guidance for long‑term planning.
5.5 Selecting
a higher projection reduces the risk of under‑estimating long‑term
demand, particularly for long‑life infrastructure where capacity
constraints are costly to correct. Lower‑than‑expected growth can
be adjusted for through future LTP cycles with comparatively limited impact.
This decision sets only a planning assumption and does not approve or alter any
projects, funding, or levels of service.
5.6 Councillors
asked whether selecting a Medium or High population assumption would influence
longer‑term rates
movements. Staff cannot advise how the two assumptions will affect the final
rates requirements for the LTP 2027–2037, as financial modelling is still
underway and depends on multiple interacting factors.
5.7 In
principle, however, the total revenue requirement in any given year is divided
across the number of rating units. If growth is higher, the same total revenue
requirement is spread across more rating units, which has a moderating effect
on the average rates increase. Over a 10‑year
period, the Medium and High scenarios differ by approximately 3.48 percentage
points in projected dwelling growth, and this difference represents the scale
of additional rating units over which future revenue requirements would be
allocated. This effect is only one component of overall rates movements and
will be assessed in more detail through the LTP financial modelling.
5.8 Staff
also used AI‑assisted analysis to explore whether councils experiencing
higher population growth tend to have higher rates than lower‑growth
councils. The findings were inconclusive and did not show a consistent
relationship. Rates movements are influenced by multiple factors beyond growth
alone, including development timing, density, funding gaps, and the sequencing
of infrastructure investment.
5.9 Projections
do not determine whether a council is “high growth”; this is based
on actual population and development trends, and there is no formal criterion
for defining high growth status. Tasman has experienced what is commonly
regarded as high growth for at least two decades and continues to maintain
comparatively low rates relative to the wider sector. Projections are planning
tools used to understand possible future demand, and risks for rates exist
under both under‑ and over‑estimating growth.
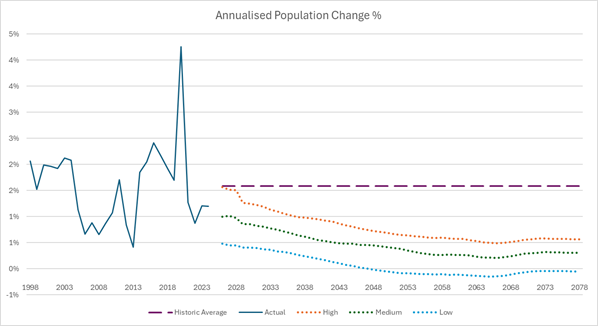
Figure 1 - Annual population change % historic,
projected, and historic average
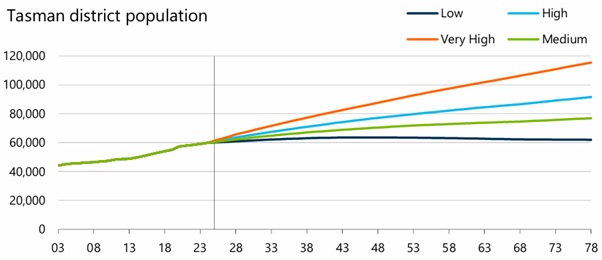
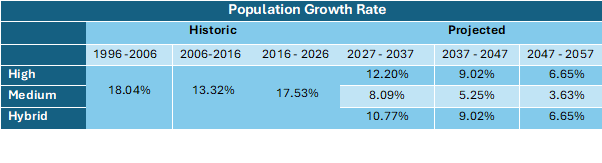 Figure 2 - Total population historic and projected
Table 1 - Historic and projected population growth
10-year average
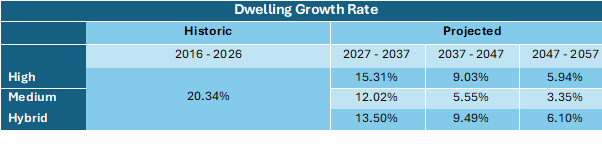
Table 2 - Historic and projected dwelling growth
10-year average
6. Financial
or Budgetary Implications / Ngā Ritenga ā-Pūtea
6.1 This decision has no direct
financial impact. It may indirectly influence long‑term revenue and
expenditure forecasting as growth assumptions flow into later stages of the LTP
programme.
7.1 The options are outlined in the
following table:
|
Option
|
Advantage
|
Disadvantage
|
|
1.
|
Approve the High scenario
|
Provides a resilient planning basis for long‑life
infrastructure, identifying the risk of under‑investment and future
capacity shortfalls.
Aligns with Tasman’s longer term growth trends,
which have tracked closer to the High projection.
Is considered to support LGA obligations to plan for the
long term and manage risk.
Identifies the likelihood of community impacts arising
from higher‑than‑expected growth
without sufficient infrastructure.
Consistent with emerging central government signals to
plan for higher growth.
Rates and debt settings can be adjusted in future LTP
cycles if actual growth is lower than projected.
|
May indicate a need for infrastructure to
be timed earlier than ultimately required if growth slows.
Could create perception of over‑planning or over‑estimating growth in the short term.
Higher growth rate could indicate earlier infrastructure
needs during preliminary modelling, which could place pressure on early
financial forecasts.
Building Consent data shows a sharp decline in building
consents applications.
|
|
2.
|
Approve the Hybrid scenario
|
Recent declines in building consent
applications indicate lower dwelling growth in the short term, and the Hybrid
scenario better reflects this early‑period slowdown.
After the initial years, the Hybrid
trajectory transitions toward a rate that more closely matches Tasman’s
longer‑term growth behaviour.
By applying the Medium projection in the
early years, the Hybrid scenario reduces the chance of signalling
infrastructure needs earlier than necessary during the first one to two LTP
years.
Switching to the High rate for later
years still provides visibility of potential long‑term
infrastructure pressures if higher growth occurs.
It avoids the binary choice between Medium and High by
recognising both current market signals and the district’s longer‑term
trend, which may reduce the likelihood of short‑term financial
pressure.
|
Using two different growth rates over the projection
period can introduce additional complexity for modelling.
The rationale for using a transitional projection may
require more explanation to stakeholders compared with a single scenario.
Central government are trending toward planning for higher
growth; the Hybrid scenario may be seen as less aligned with that direction.
Applying the Medium rate early could delay the
identification of future infrastructure requirements if high growth resumes
sooner than expected.
|
|
3
|
Approve the Medium scenario
|
Aligns with the demographer’s
statistical assessment of the most likely population trajectory.
Aligns with sort term growth expectations
based on building consent applications being received.
May indicate a lower need for
infrastructure timing and capital expenditure assumptions if growth
moderates.
Could be perceived as a more conservative
or “right‑sized”
approach to current economic conditions
|
Increases the risk of under‑estimating future demand, particularly for long‑life infrastructure that is costly and slow to expand once
constrained.
Higher‑than‑expected growth can lead to community impacts that are more
difficult and costly to address than adjusting for lower growth over time.
Does not fully reflect recent or
long-term historic trends, which exceed the higher projection.
Provides less alignment with emerging
central government direction to plan for higher growth.
May require earlier corrective action if
growth exceeds expectations.
|
|
4
|
Approve the Low scenario
|
Lower assumed demand in the early years reduces the
likelihood of identifying infrastructure upgrades earlier than ultimately
required during preliminary modelling.
Can signal caution in the current economic environment by
avoiding assumptions that may appear optimistic or out of step with recent
slowdown.
Lower projected growth may reduce initial pressures on
debt, funding pathways, or capital programme assumptions during early
modelling stages.
|
If higher growth resumes, as has occurred historically,
this scenario may result in infrastructure capacity constraints that are
costly and slow to correct.
Under‑projecting growth can push key investments too
far into the future during modelling, increasing later pressure on levels of
service, compliance, and financial planning.
Diverges from national signals encouraging councils to
adopt more risk‑aware and future‑proofed growth planning
approaches.
|
7.2 Option 1 High growth scenario is
recommended.
8.1 The decision is primarily
governed by the Local Government Act 2002, which sets the requirements for LTP
assumptions, prudent financial management, and decision‑making processes.
The Resource Management Act 1991, particularly the National Policy Statement on
Urban Development, is also relevant as growth projections inform long‑term
land‑use and infrastructure planning. No other legislation directly
affects or constrains this assumption‑setting decision.
8.2 The following provisions of the
Local Government Act 2002 were considered particularly relevant to this
decision, and the recommendation has been assessed for alignment with them: the
purpose and principles in sections 10 and 14, the financial management
obligations in section 101, the decision‑making and engagement
requirements in sections 76–82, and the risk‑management
requirements for LTP assumptions in Schedule 10, clause 17. These sections
guided the assessment to support prudent, risk‑aware long‑term planning.
9. Iwi
Engagement / Whakawhitiwhiti ā-Hapori Māori
9.1 Engagement with iwi has not been
undertaken and is not proposed as this decision sets an internal planning
assumption and does not directly affect land, water, cultural values, or levels
of service. In line with the LGA 2002 requirement for engagement to be
proportionate to significance, iwi engagement is not required at this stage,
with any future implications addressed through subsequent LTP or statutory
processes.
10. Significance
and Engagement / Hiranga me te Whakawhitiwhiti ā-Hapori Whānui
10.1 The overall significance of the decision has been
assessed as low to moderate
|
|
Issue
|
Level of
Significance
|
Explanation of
Assessment
|
|
1.
|
Is there a high level
of public interest, or is decision likely to be controversial?
|
Medium
|
Some level of interest may arise
from stakeholders who follow growth and planning matters, but the decision is technical and does not
directly change services or rates at this stage. It may attract attention
from specific stakeholders, but is not expected to be widespread.
|
|
2.
|
Are there impacts on
the social, economic, environmental or cultural aspects of well-being of the
community in the present or future?
|
Medium
|
The decision
influences long‑term planning assumptions but does not directly change
services, assets, or financial settings at this stage. Any effects on
community well‑being would occur indirectly through later LTP
decisions, so impacts are possible but not immediate or substantial.
|
|
3.
|
Is there a
significant impact arising from duration of the effects from the decision?
|
Low
|
The decision sets an
assumption for planning purposes only. Any long‑term effects depend on
later LTP decisions, so the duration of impact from this specific decision is
limited.
|
|
4.
|
Does the decision
relate to a strategic asset? (refer Significance and Engagement Policy for
list of strategic assets)
|
Low
|
The decision informs
planning for Council’s strategic infrastructure assets but does not
alter, dispose of, or reprioritise any specific asset at this stage. The link is
indirect, so the level of significance is medium rather than high.
|
|
5.
|
Does the decision
create a substantial change in the level of service provided by Council?
|
Low
|
The decision does not change any
levels of service. It only sets a planning assumption, so no substantial
service impacts arise at this stage.
|
|
6.
|
Does the proposal,
activity or decision substantially affect debt, rates or Council finances in
any one year or more of the LTP?
|
Low
|
The decision does not directly
change financial settings. Any effect on debt or rates would occur later
through LTP processes, so the immediate financial impact of this decision is
low.
|
|
7.
|
Does the decision
involve the sale of a substantial proportion or controlling interest in a CCO
or CCTO?
|
NA
|
The decision does not involve
any sale of shareholdings in a CCO or CCTO.
|
|
8.
|
Does the
proposal or decision involve entry into a private sector partnership or
contract to carry out the deliver on any Council group of activities?
|
NA
|
The decision does not involve
entering into any private sector partnership or contracting out any Council
activity.
|
|
9.
|
Does the proposal or
decision involve Council exiting from or entering into a group of
activities?
|
NA
|
The decision does not involve
entering into or exiting from any group of activities.
|
|
10.
|
Does the proposal
require particular consideration of the obligations of Te Mana O Te Wai
(TMOTW) relating to freshwater or particular consideration of current
legislation relating to water supply, wastewater and stormwater
infrastructure and services?
|
Low
|
While the growth projection will
inform future infrastructure planning for water services, this decision does
not itself change any water, wastewater or stormwater activities, nor does it
trigger specific Te Mana o te Wai obligations. Current water sector reforms
do not materially affect or change the nature of this assumption‑setting
decision.
|
11. Communication
/ Whakawhitiwhiti Kōrero
11.1 Communication to date has been internal and with
Nelson City Council (NCC) officers, including discussions with engineering,
planning, ELT and other staff who rely on the Growth Model for LTP inputs.
Staff have also engaged with NCC to understand whether there is an opportunity
to align approaches.
11.2 NCC currently propose using the Medium scenario for
their LTP and the High scenario for other planning purposes, reflecting the
demographer’s advice that actual growth is statistically more likely to
track near the Medium projection. Council staff have considered this advice in
the context of Tasman’s infrastructure risk profile and planning
requirements and have formed their recommendation accordingly.
12.1 The overall risk is assessed as medium and relates
to the planning consequences of selecting a higher or lower population
projection.
12.2 Adopting the High scenario carries the risk
that actual growth may be lower than projected, which could indicate
infrastructure timing earlier than necessary and create perceptions of over‑planning. Any
implications arising from this assumption can be addressed through later stages
of this LTP or future LTP and annual plan cycles.
12.3 Not adopting the High scenario increases the
possibility of under‑estimating long‑term demand,
which is difficult and costly to correct once infrastructure constraints
emerge. This risk profile has greater potential implications for levels of
service, compliance, and financial sustainability.
12.4 Mitigation includes ongoing monitoring of growth,
regular reassessment through LTP cycles, annual plan cycles, and refinement of
infrastructure and financial assumptions as new information becomes available.
12.5 Revising the population assumption at a
later stage will require re‑work for the Growth Model and for any Council
outputs that rely on it, which may in turn delay delivery of the LTP programme.
12.6 If Nelson City Council adopts a lower
projection, there is a possibility of divergence in long‑term
assumptions. This does not materially alter the assessment undertaken for
Tasman. However, if higher growth occurs in Nelson without corresponding
provision, demand may shift toward Tasman, with potential implications for
infrastructure planning and cost‑allocation, noting that cross‑boundary
demand could arise under any scenario if actual growth exceeds local provision.
13. Climate
Change Considerations / Whakaaro
Whakaaweawe Āhuarangi
13.1 The decision in this report was considered by staff
in accordance with the processes set out in Council’s Climate Change
Consideration Guide.
13.2 This decision will have no impact on greenhouse gas
emissions. This decision will have no impact on resilience to climate change
and the ability of the Council to proactively respond to the impacts of climate
change.
14. Alignment
with Policy and Strategic Plans / Te Hangai ki ngā aupapa Here me ngā
Mahere Rautaki Tūraru
14.1 This decision supports the development of the Long‑Term Plan by establishing a planning assumption required under the
Local Government Act 2002. The population projection informs, but does not
determine, subsequent work on infrastructure, financial, and land‑use planning. Any future implications for levels of service,
infrastructure programmes, or financial settings will be considered through
later LTP processes or other statutory planning documents, including asset
management plans, the Financial Strategy, Infrastructure Strategy, and the
Tasman Resource Management Plan.
14.2 The decision is within the delegation of the
Strategy, Finance and Performance Committee, which is responsible for oversight
of LTP preparation and underlying assumptions
15. Conclusion
/ Kupu Whakatepe
15.1 The High population projection is considered to
provide a sound planning assumption for the development of the Long‑Term Plan and the associated Growth Model update. It offers a
resilient basis for identifying future infrastructure and land‑use pressures while allowing any financial implications to be
addressed through later LTP processes. The decision does not commit Council to
any specific programme or funding pathway and can be refined in future planning
cycles as new information becomes available.
16. Next
Steps and Timeline / Ngā Mahi Whai Ake
16.1 Growth
Model outputs are on schedule for May 2026, allowing them to feed into wider
LTP programme.
|
1.⇩
|
Population
Projection Technical Options Analysis
|
27
|
|
2.⇩
|
Infometrics
Tasman projection report
|
40
|
Strategy Finance and
Performance Committee Agenda – 19 March 2026

Strategy Finance and
Performance Committee Agenda – 19 March 2026


Strategy Finance and
Performance Committee Agenda – 19 March 2026
7.4 Adoption of Tasman Inundation Practice Note
Decision Required
|
Report
To:
|
Strategy
Finance and Performance Committee
|
|
Meeting
Date:
|
19
March 2026
|
|
Report
Author:
|
Paula
Hammond, Policy Planner - Natural Resources
|
|
Report
Authorisers:
|
Barry
Johnson, Environmental Policy Manager; Sue McLean, Group Manager - Strategy
& Finance
|
|
Report
Number:
|
RSFP26-03-1
|
1. Purpose
of the Report / Te Take mō te Pūrongo
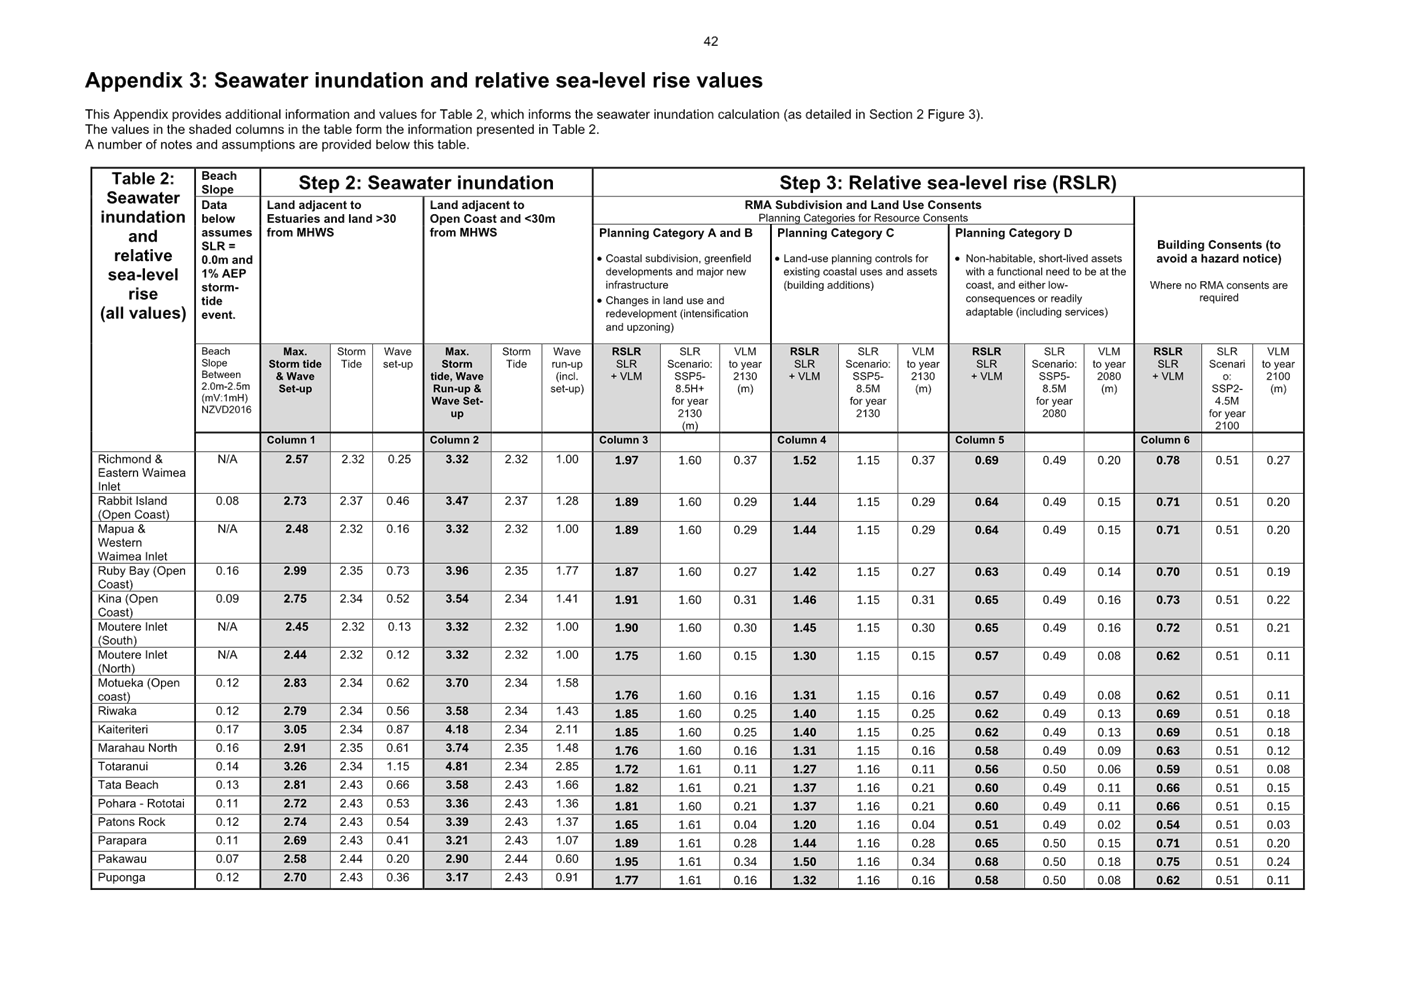
1.1 This
report seeks the Council’s approval to adopt the Tasman Inundation
Practice Note (2026) (Attachment 1), incorporating minor amendments following
community engagement in late 2025/early 2026.
2. Summary
/ Te Tuhinga Whakarāpoto
2.1 The Strategy and Policy Committee (18 September 2025 meeting)
approved release of the draft Tasman Inundation Practice Note (2025) for
community engagement (RSPC25-09-10).
2.2 The Inundation Practice Note (IPN) is non-statutory guidance that
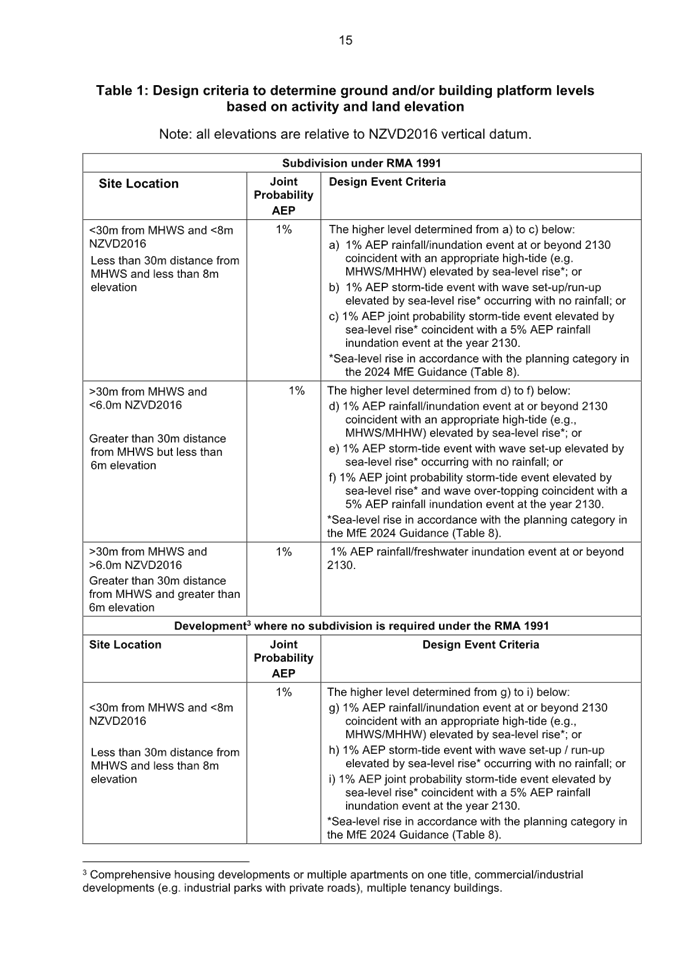
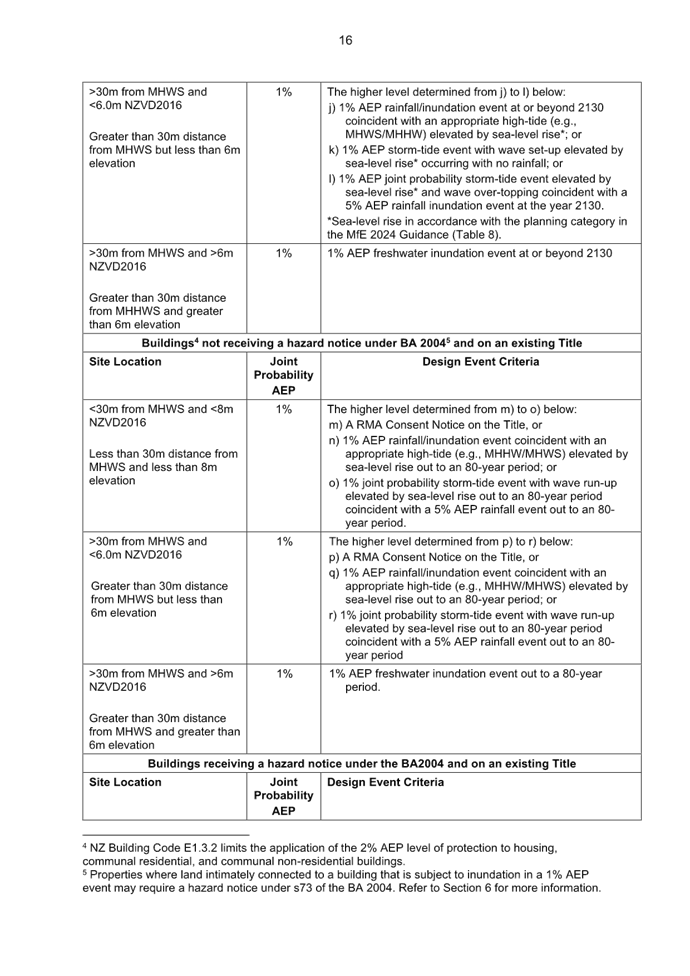
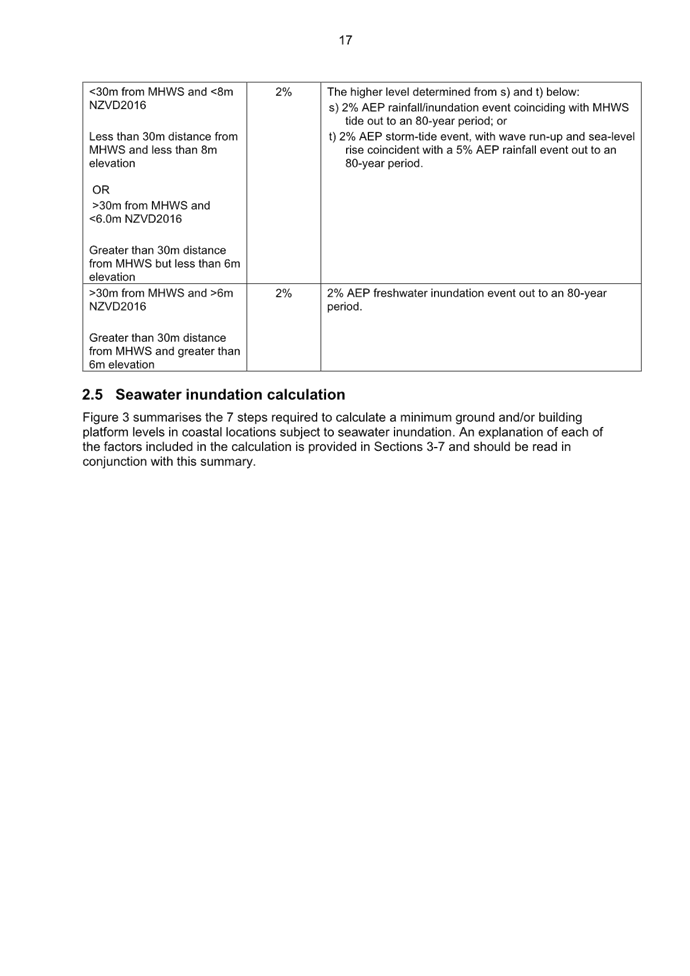
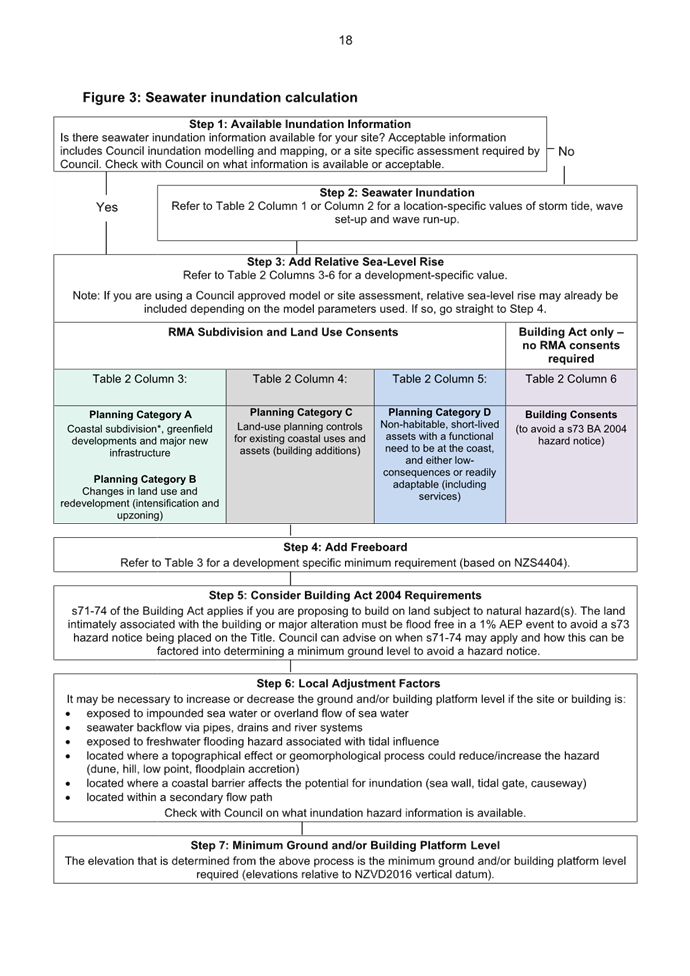
provides a standardised methodology to determine minimum ground and/or building
platform levels for development exposed to inundation (freshwater and coastal).
It assists implementation of the Resource Management Act 1991(RMA), the
Tasman Resource Management Plan (TRMP), and Building Act 2004 (BA).
2.3 During November 2025 to February 2026, Council sought community
feedback and five responses were received. Staff response to the feedback and
recommended amendments to the IPN are summarised in this report, with the full
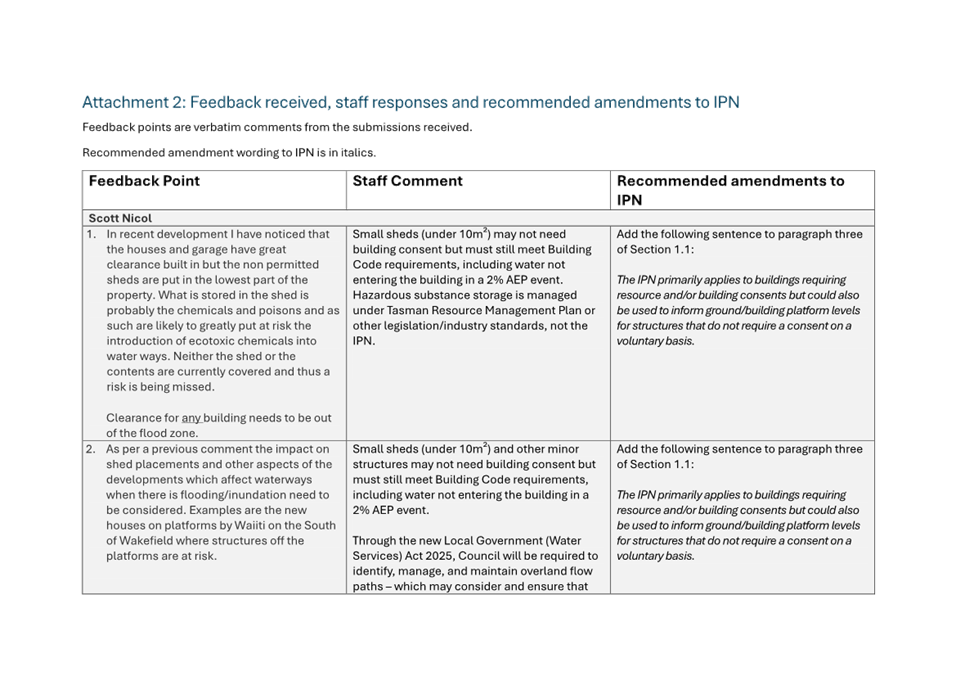
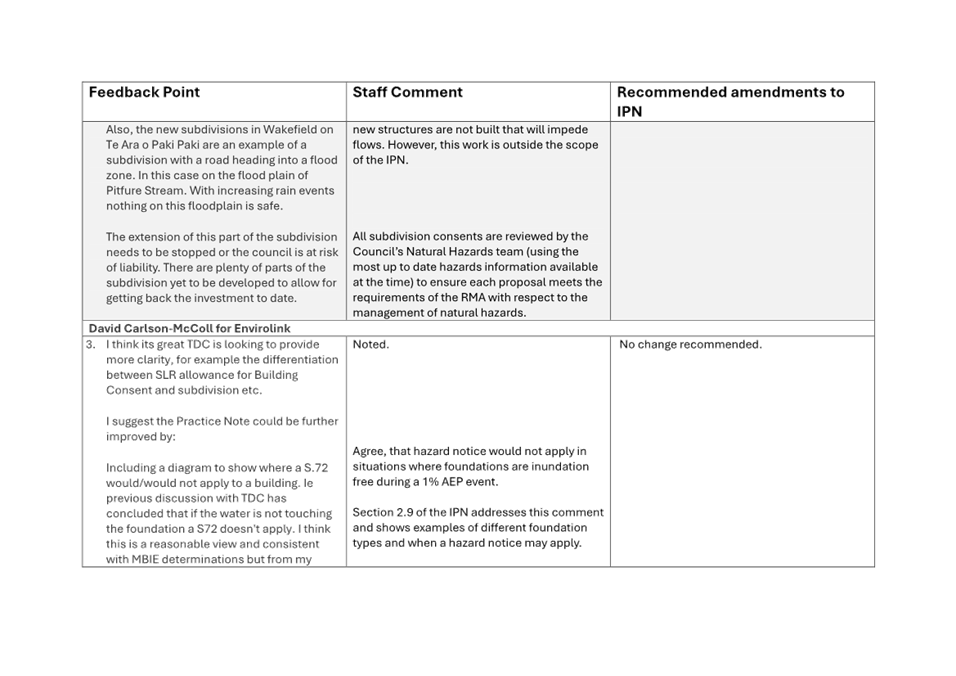
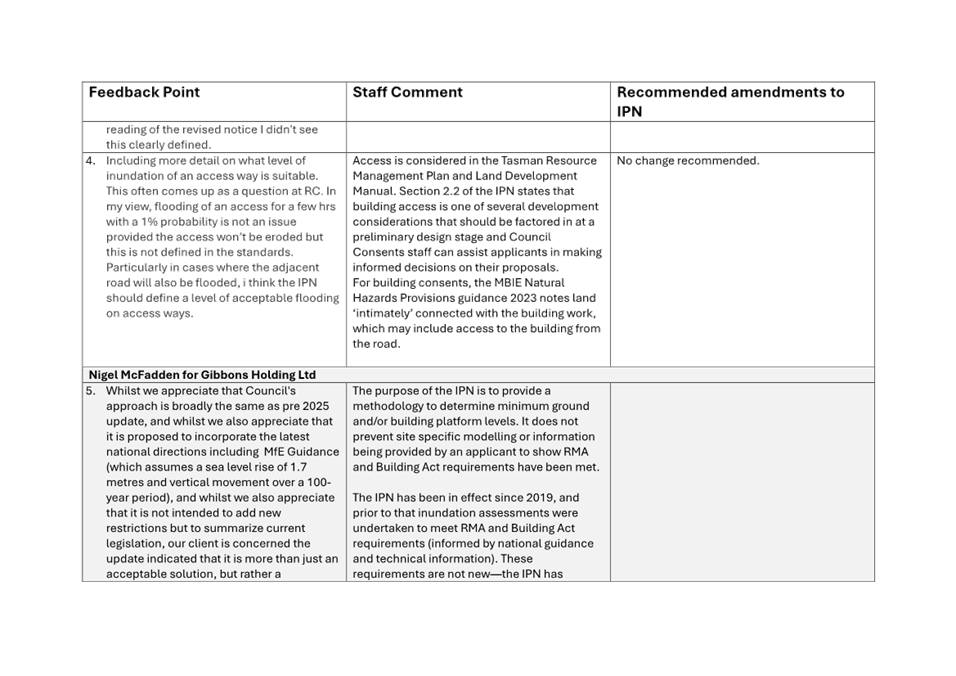
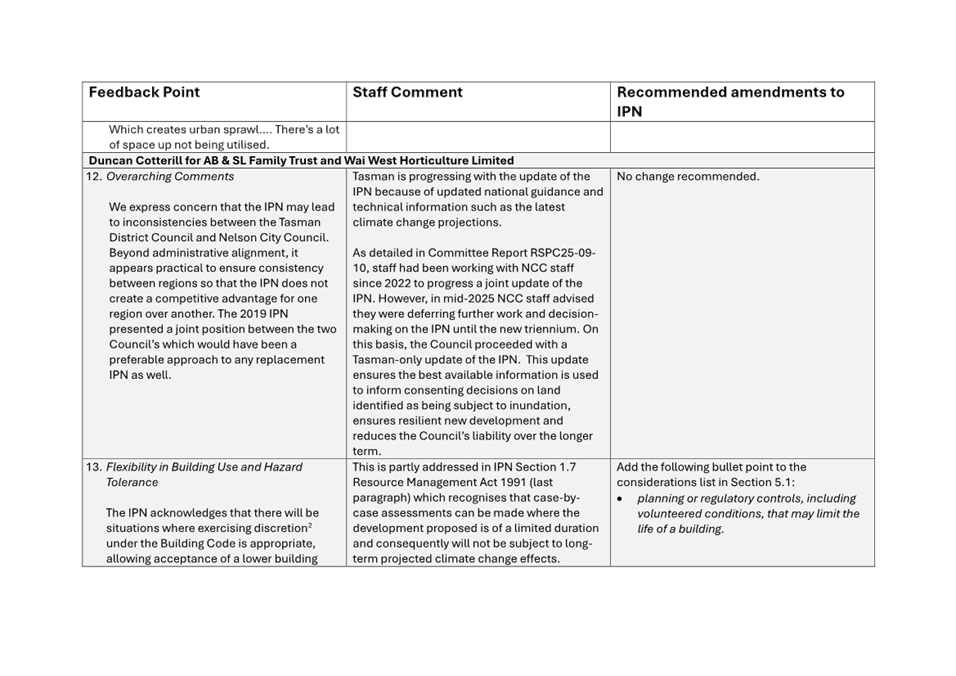
feedback table presented in Attachment 2.
2.4 The feedback received was constructive and focused primarily on
clarifying the application of the IPN, particularly in relation to minor
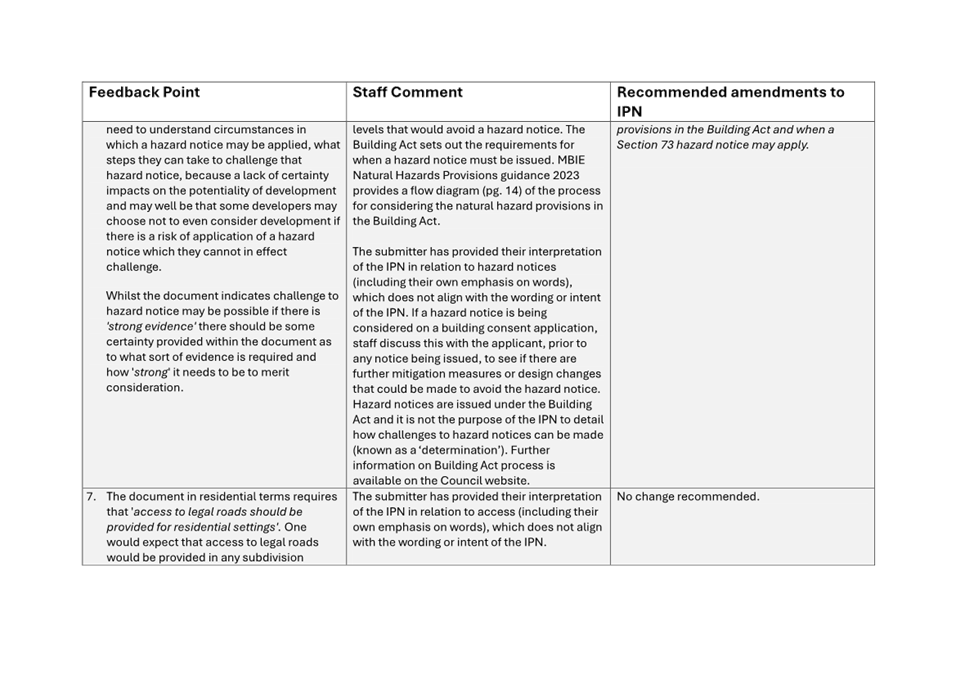
structures, access and curtilage considerations, hazard notices, and the
interpretation of national guidance. There were no objections to the overall
methodology.
2.5 A
copy of the Tasman Inundation Practice Note 2026 for adoption is provided in
Attachment 1 with the recommended amendments included. Details
of the recommended amendments, including the specific locations within the IPN
where the changes have been incorporated, are provided in Attachment 2.
3. Recommendation/s
/ Ngā Tūtohunga
That the Strategy Finance and Performance Committee
1. receives
the report Adoption of Tasman Inundation Practice Note RSFP26-03-1; and
2. approves the recommended amendments to the Tasman
Inundation Practice Note in response to community engagement (as set out in
Attachment 2), noting that all requested amendments have been incorporated in
Attachment 1 to the agenda report; and
3. adopts the Tasman Inundation Practice Note 2026,
Attachment 1 to the agenda report.
What is the Inundation Practice Note?
4.1 The IPN was
originally developed jointly with Nelson City Council (NCC) and adopted in 2019
to provide a consistent methodology for determining appropriate minimum ground
and/or building platform levels for development in areas at risk of seawater
and/or freshwater inundation. It is non-statutory guidance that supports the
TRMP, RMA and the administration of the BA.
4.2 Since adoption,
central government guidance and local technical datasets have been updated and
evolved. Tasman has progressively implemented these updates in consenting
practice, as the new guidance and data has become available.
4.3 Tasman and
Nelson staff had been working since mid-2022, toward completing a review and
update of the 2019 IPN. However, Nelson deferred decisions on reviewing and
updating the IPN to this triennium. Tasman prepared a standalone Tasman IPN
(2025) to align the document with current practice, national guidance and
updated technical data.
4.4 The Strategy and Policy Committee (18 September 2025 meeting)
approved an update of the 2019 Inundation Practice Note independently of Nelson
City Council and approved the draft Tasman Inundation Practice Note (2025) for
community engagement and feedback (RSPC25-09-10).
Engagement Undertaken
4.5 Public feedback
on the draft Tasman IPN (2025) was sought from November 2025 to February 2026
through Council’s communications channels (Shape Tasman, Newsline, social
media) with targeted outreach to Post Settlement Governance Entities, the
development and building sector, and planners via emails and sector
newsletters.
4.6 Key documents,
including a summary of the proposed changes, and a track change version of the
IPN were available on Shape Tasman to support feedback. A video offered a
summary of the IPN and provided a practical example of how the IPN could be
applied.
4.7 Five submissions
were received with the key themes and responses summarised in section 5 below,
with a detailed assessment set out in Attachment 2.
5. Analysis
and Advice / Tātaritanga me ngā tohutohu
5.1 The community engagement process from
November 2025 to February 2026 provided Council with valuable insights from a
range of stakeholders, including two lawyers on behalf of a developer and
landowners, one consultancy representative, and two members of the public.
While the volume of submissions was modest, the feedback received was
constructive and focused primarily on clarifying the application of the IPN,
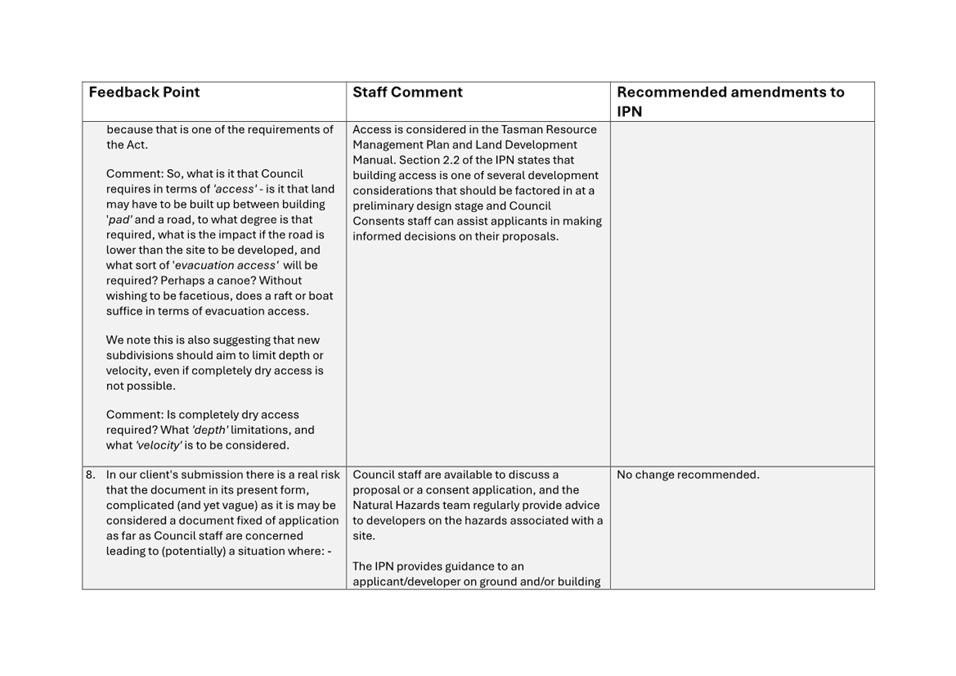
particularly in relation to minor structures, access considerations, hazard
notices, and the interpretation of national guidance. The volume of feedback
received is consistent with the low to medium level of interest anticipated for
this technical document and is on par with the three responses received via the
2019 IPN consultation.
5.2 Attachment 2 details staff responses and
recommended amendments to the IPN for each individual submission point.
Key feedback
points and staff recommendations
5.3 Submitters sought greater clarity on how the IPN applies in
practice, particularly for minor structures, hazard notices, and access or
curtilage requirements. They noted issues such as small, unconsented sheds
located in low‑lying areas, uncertainty around when Building Act hazard
notices apply, and how to interpret MBIE guidance. Staff recommend minor
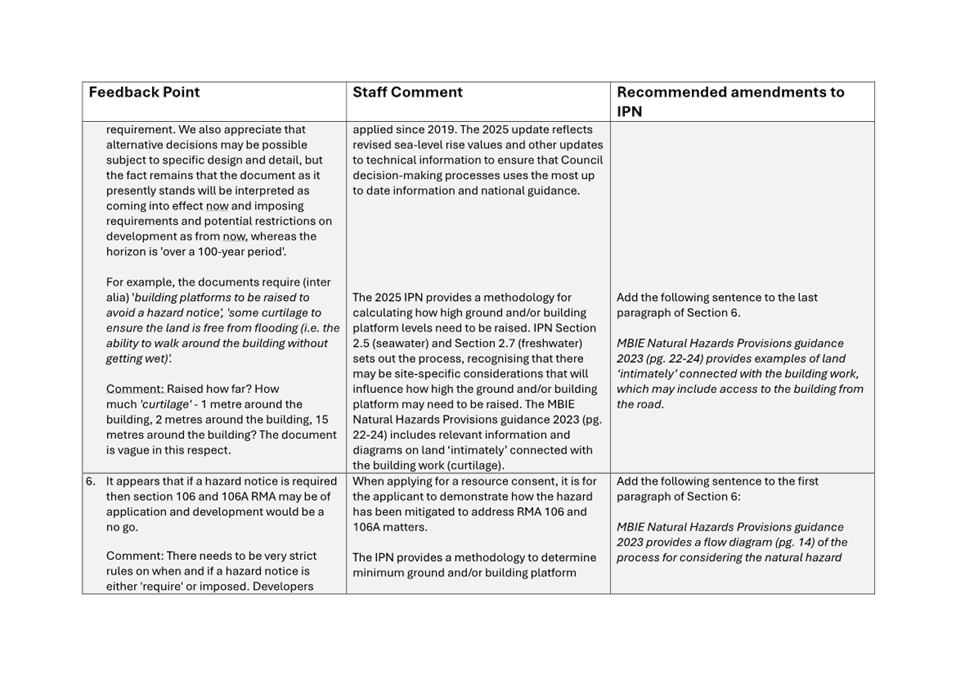
clarifications to Sections 1.1 and 6 of the IPN, including cross‑references
to MBIE diagrams and guidance. No changes are recommended where the Tasman
Resource Management Plan, Land Development Manual or national direction
addresses the feedback points within these higher-order documents.
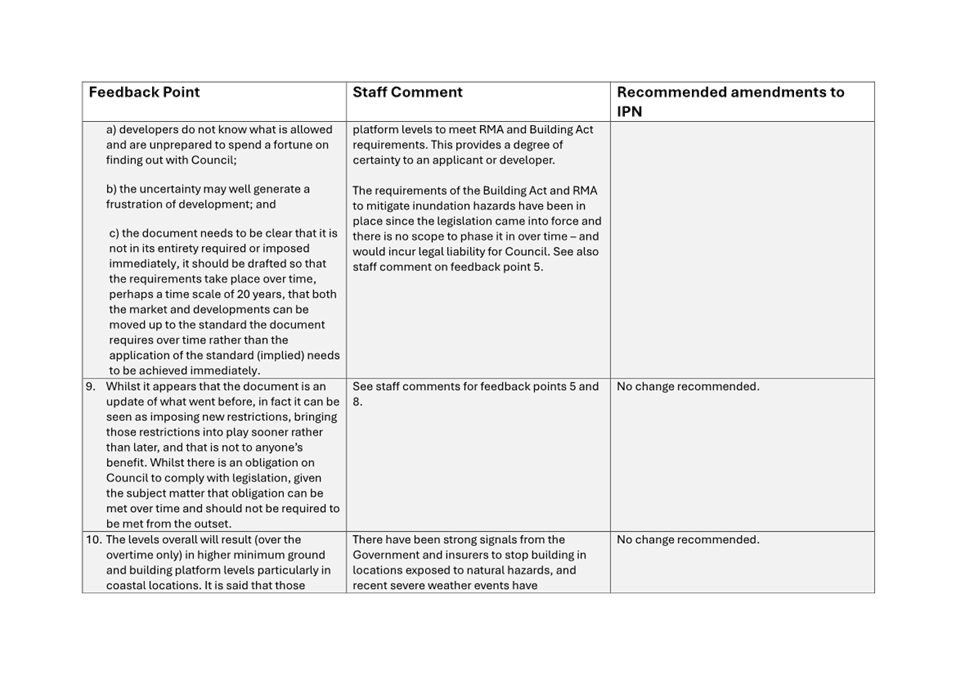
5.4 Feedback also touched on implementation concerns, including the
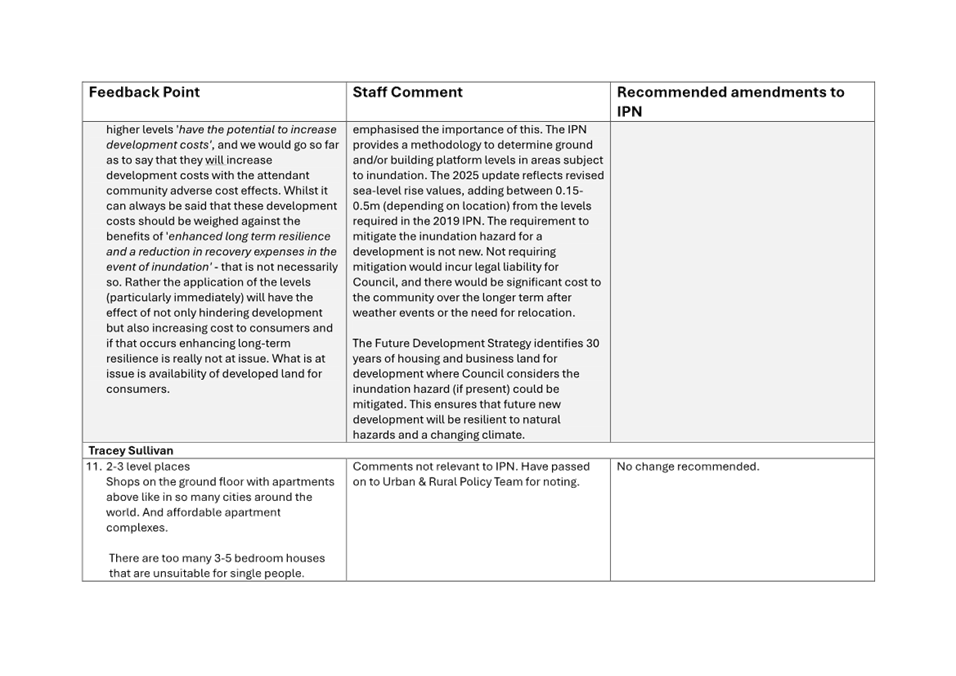
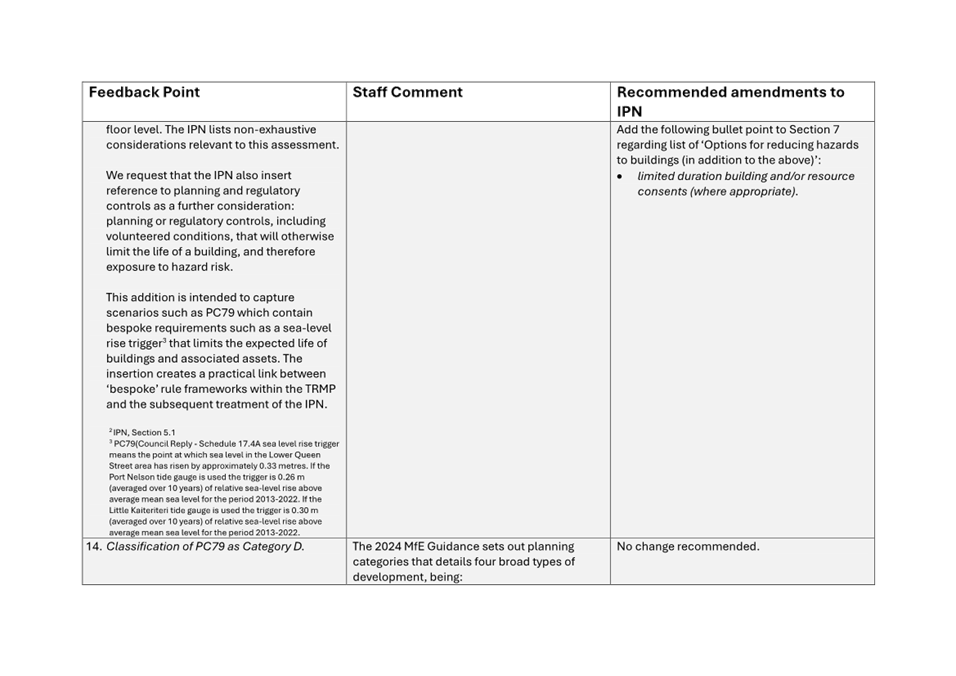
immediate effect of higher platform levels, cost implications, the treatment of
limited‑duration or trigger‑based consents, and alignment with
Nelson City Council. While recognising these issues, staff note that statutory
obligations to manage inundation hazards already exist, and phased
implementation of mitigation measures is not required as the requirement in
some instances to have higher platform levels is already being applied through
building and resource consents.
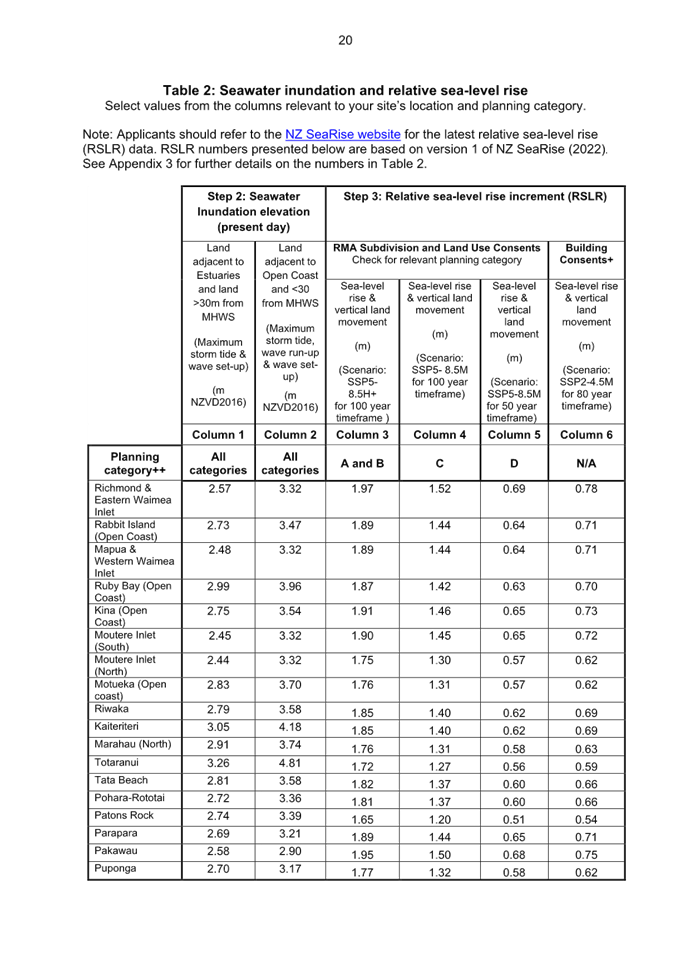
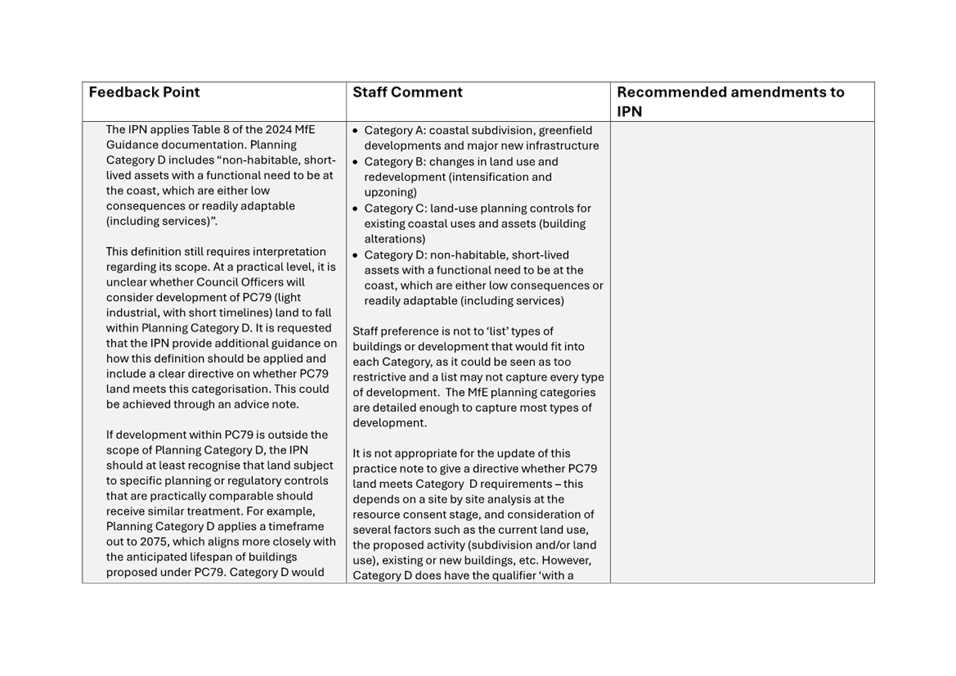
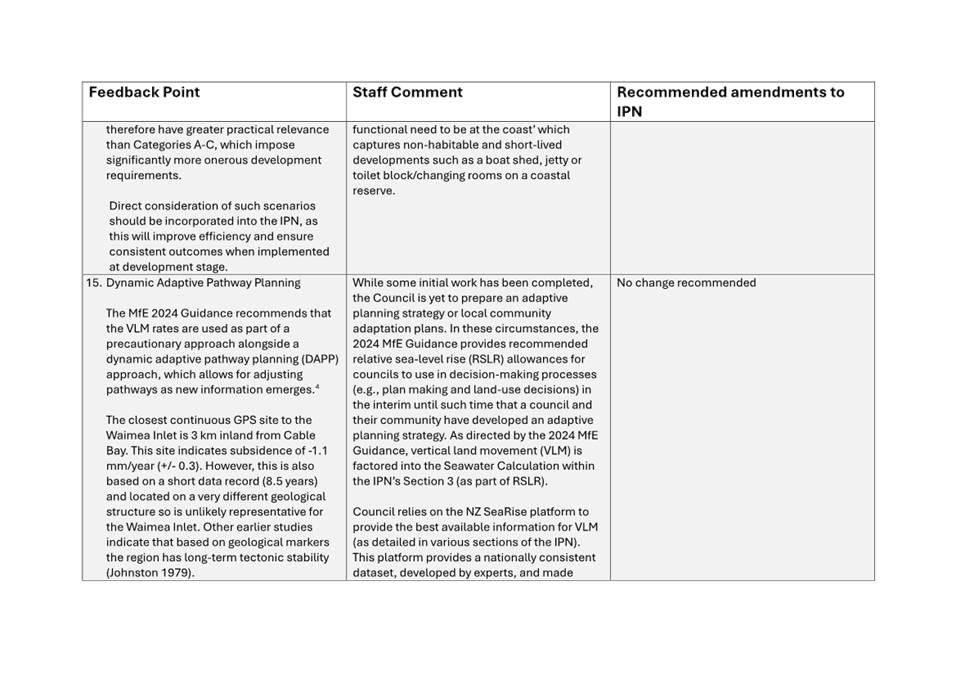
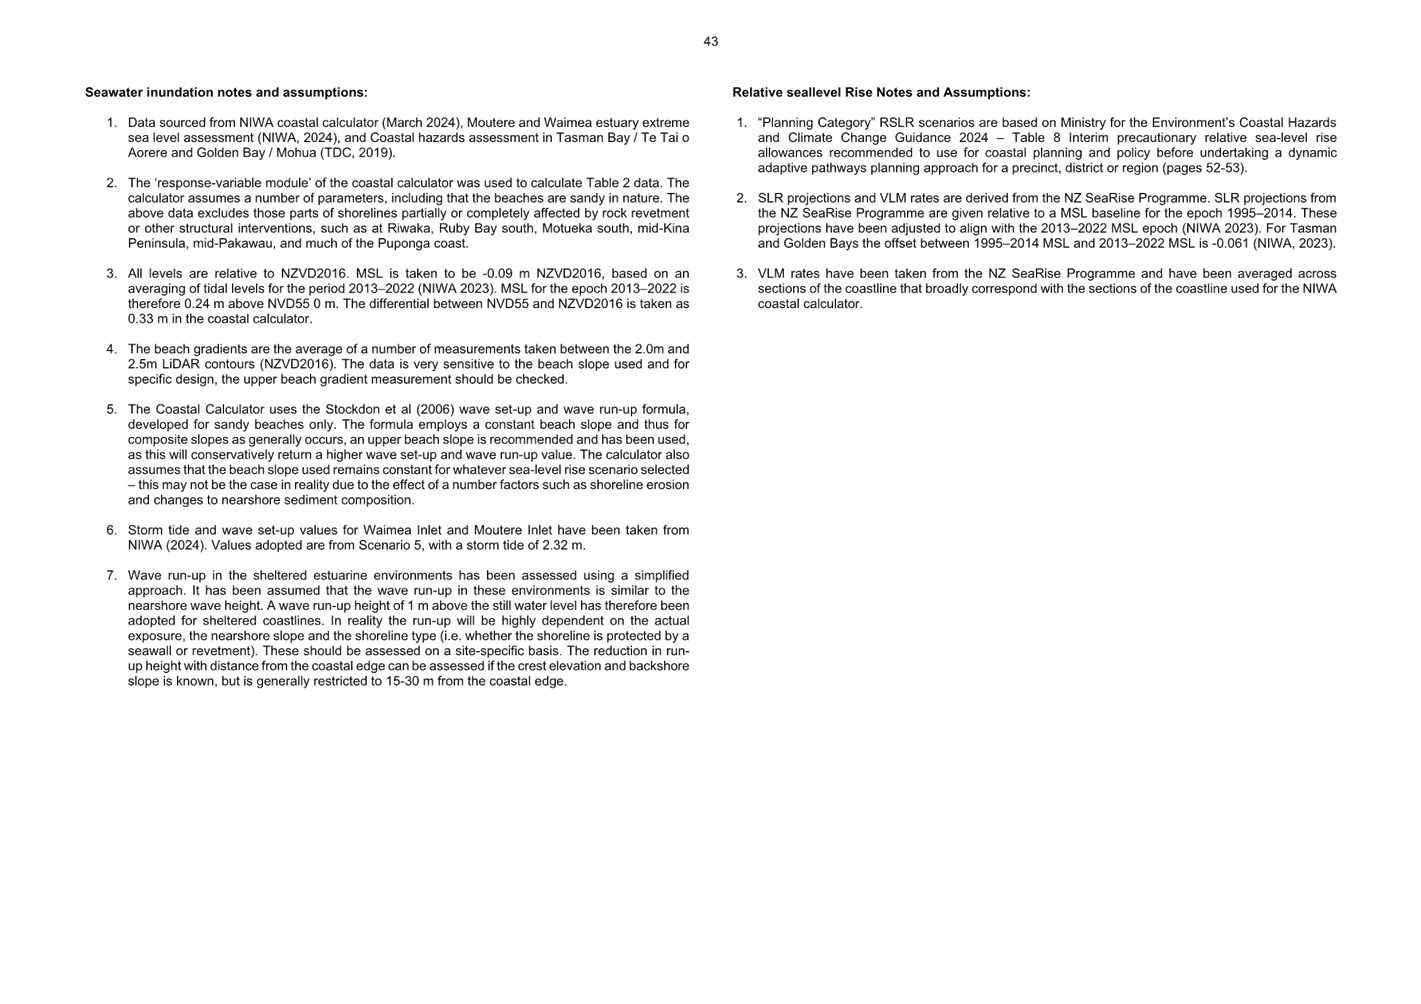
5.5 A further set of comments related to technical matters such as the
application of MfE guidance’s ‘planning categories’,
uncertainty in use of national vertical land movement data, and adaptive
pathways planning. Staff comments confirmed that the IPN reflects national
guidance, the NZ SeaRise data remains the best information available, and no
local vertical land movement work is planned at this time. No changes are
recommended on these points.
6. Financial
or Budgetary Implications / Ngā Ritenga ā-Pūtea
Review and feedback process
6.1 Costs for the update to the IPN
and community engagement were met from existing staff and operational budgets.
No additional funding is required to complete the updated Tasman IPN 2026.
Financial implications for the community
6.2 The IPN sets out
the methodology for determining minimum ground and building platform levels to
reduce the risk of inundation. Meeting these levels may involve raising land
or, in some cases, elevating buildings on piles. While such measures add to
construction costs, they need to be weighed against the potentially much higher
costs of repairs and recovery if a property is inundated.
6.3 There is also a
potential financial cost to Council if, following an inundation event, it is
found that Council did not follow national guidance or use the most up‑to‑date
information; applying the IPN helps avoid this potential liability. Having the
IPN 2026 in place therefore reduces future financial risk to Council by
ensuring that decisions are based on current national guidance and the best
available data, providing a clear and defensible basis for managing inundation
hazards.
7.1 The options are outlined in the
following table:
|
Option
|
Advantage
|
Disadvantage
|
|
1.
|
Agree to the staff recommended changes
and adopt the amended IPN (see Attachment 2) as the IPN 2026.
|
This option shows that submitter views
have been considered by staff and, where appropriate, amendments have been
made to the IPN.
Provides a clear and defensible basis for
decision-making and reduces Council’s legal and reputational risk.
|
Not every
submission point has been accepted. Some submitters may therefore be
disappointed that their suggestions were not given effect to in the amended
IPN. However, this is part of the feedback process, and not all suggestions
will be deemed appropriate based on staff technical advice.
|
|
2.
|
Adopt the draft IPN 2025 as the final IPN
without amendment, other than the amendments necessary to change the IPN from
a “draft” to the “final” IPN.
|
Provides a clear and defensible basis for
decision-making and reduces Council’s legal and reputational risk.
|
The Council will be open to criticism for
not listening to the community’s views through the public consultation
process, particularly when some valid feedback was provided that can improve
the final version of the IPN.
|
|
3.
|
Do nothing and remain with the 2019 Joint
Nelson Tasman IPN
|
There are no advantages with this option.
|
The 2019 IPN contains outdated data and
is inconsistent with national guidance.
Misalignment with current TDC practice of
applying most update-to-date data to inform building platform and/or land
levels.
Applying the 2019 IPN may understate the
inundation risk, in particular exposing low-lying coastal developments to
inundation earlier than expected (due to not taking
into account national guidance on updated sea-level rise data and vertical
land movement).
Does not provide a clear and defensible
basis for decision-making and increases Council’s legal and
reputational risk.
|
7.2 Option 1 is recommended.
8.1 The IPN is
non-statutory guidance that supports implementation of the RMA, the BA, and
relevant polices and rules in the TRMP. Aligning the IPN with current national
guidance and the best available information provides a clear and defensible
basis for decision-making and reduces Council’s legal and reputational
risk.
8.2 The update to
the IPN has been prepared, and feedback sought and considered in accordance
with the requirements of the Local Government Act 2002.
8.3 On 15 January 2025, the National Policy
Statement for Natural Hazards (NPS-NH) came into force with immediate
application to resource consent decision-making. The
NPS-NH sets out a balanced way for councils to manage natural hazard risks in
new developments, based on the level of risk involved. The
IPN 2026 provides a methodology for mitigating inundation hazards to reduce the
level of risk, consistent with the objective of the NPS-NH.
9. Iwi
Engagement / Whakawhitiwhiti ā-Hapori Māori
9.1 In addition to the broad community
engagement process, feedback on the draft IPN 2025 was directly sought through
the Post Settlement Governance Entities. No feedback was received.
10. Significance
and Engagement / Hiranga me te Whakawhitiwhiti ā-Hapori Whānui
10.1 Overall, staff consider the decision to adopt the
IPN 2026 is of low/medium significance.
|
|
Issue
|
Level of
Significance
|
Explanation of
Assessment
|
|
1.
|
Is there a high level
of public interest, or is decision likely to be controversial?
|
Low
|
The IPN has been in
place since 2019 and much of the development industry is familiar with the
practice note.
Feedback was sought
from the community and development sector, with amendments made to the IPN to
address feedback points where appropriate.
|
|
2.
|
Are there impacts on
the social, economic, environmental or cultural aspects of well-being of the
community in the present or future?
|
Low-Medium
|
The updated IPN may impact on
present or future generations in a minor way, for example the cost of
construction of increased building platform levels will mean higher build
costs which may be passed on through rent and indirect charges from a
business using the building. Conversely the cost of not raising ground or
building platform levels could be considered a negative impact on present or
future generations, if buildings become inundated in future storm events
putting life and property at risk.
|
|
3.
|
Is there a
significant impact arising from duration of the effects from the decision?
|
Low
|
The IPN can be reviewed at any
time. Future reviews of the IPN could take place following climate change
adaptation work or further updates to national guidance.
|
|
4.
|
Does the decision
relate to a strategic asset? (refer Significance and Engagement Policy for
list of strategic assets)
|
N/A
|
No
|
|
5.
|
Does the decision
create a substantial change in the level of service provided by Council?
|
Low
|
The IPN will not
impact the level of service provided by the Council. The IPN will provide
clarity on Council’s approach to setting minimum ground or building
platforms.
|
|
6.
|
Does the proposal,
activity or decision substantially affect debt, rates or Council finances in
any one year or more of the LTP?
|
Low
|
The IPN will not
impact on Council’s debt, level of rates charged or Council’s
financial capacity.
|
|
7.
|
Does the decision
involve the sale of a substantial proportion or controlling interest in a CCO
or CCTO?
|
N/A
|
N/A
|
|
8.
|
Does the
proposal or decision involve entry into a private sector partnership or
contract to carry out the deliver on any Council group of activities?
|
N/A
|
N/A
|
|
9.
|
Does the proposal or
decision involve Council exiting from or entering into a group of
activities?
|
N/A
|
N/A
|
|
10.
|
Does the proposal
require particular consideration of the obligations of Te Mana O Te Wai
(TMOTW) relating to freshwater or particular consideration of current
legislation relating to water supply, wastewater and stormwater
infrastructure and services?
|
Low
|
The IPN does not
require particular considerations relating to TMOTW.
|
11. Communication
/ Whakawhitiwhiti Kōrero
11.1 Consultation on the
proposed update has been completed (as detailed in Sections 4 and 9), and minor
amendments to the IPN are recommended in response to the feedback received. The
five stakeholders who provided feedback have been made aware of this report and
the proposed responses to their feedback.
11.2 Following adoption of the IPN 2026, the website will be updated and
the IPN made available. Stakeholders will be informed of the update through
emails and sector newsletters.
12.1 There is an ongoing risk
that developers and landowners will see the IPN 2026 causing increased costs
due to higher building platform or ground level requirements (as a result of
national guidance regarding sea-level rise). However, this risk can be effectively
mitigated through proactive engagement with the development sector, coupled
with clear communication that highlights the long-term benefits of resilience,
including reduced recovery costs and enhanced sustainability of developments.
12.2 Adoption of the IPN 2026
reduces Council’s legal and reputational liability by ensuring that
decisions on minimum ground and building platform levels are based on the most
up‑to‑date national guidance and best available technical
information, providing a clear and defensible basis for resource and building
consent decisions. By applying the updated IPN, the Council avoids the
potential future costs and liability that could arise if developments are
affected by inundation and it is found that Council did not follow current
guidance or use the best information available.
13. Climate
Change Considerations / Whakaaro
Whakaaweawe Āhuarangi
13.1 Adopting the IPN 2026 strengthens Tasman’s
ability to manage, adapt and respond to climate related risks. The Tasman
Climate Action Plan (2024-2027) has a short-term action 2(a)(ii) for regulatory
activities (resource and building consenting) to continue to account for
inundation and sea level rise based on Ministry for the Environment guidance
and apply the 'Inundation Practice Note’ for setting minimum ground and
floor levels for subdivision, new buildings, and major alterations. Updating
the IPN document is in accordance with the Tasman Climate Action Plan.
14. Alignment
with Policy and Strategic Plans / Te Hangai ki ngā aupapa Here me ngā
Mahere Rautaki Tūraru
14.1 Adoption of the IPN 2026 supports the Long-Term
Plan’s strategic priorities, particularly ‘Strong resilient and
inclusive communities’, and ‘Enabling positive and sustainable
development’.
14.2 Numerous provisions in the TRMP require natural
hazard considerations. The IPN 2026 provides a methodology and approach to
setting appropriate resilient ground and building platform levels to mitigate
the effects of natural hazards. The IPN 2026 also assists with the
Council’s administration of the Building Act 2004 by providing the
methodology and approach for determining whether a hazard notice is required
for a development.
15. Conclusion
/ Kupu Whakatepe
15.1 The IPN is a standardised
methodology to determine minimum ground and/or building platform levels for
development exposed to inundation (freshwater and coastal). It is an important
tool to assist in mitigating inundation hazards.
15.2 Consultation on the
proposed update has now been completed and minor amendments to the IPN are
recommended in response to the feedback received.
15.3 Council consideration and adoption of the IPN 2026
is now required to complete the process.
16. Next
Steps and Timeline / Ngā Mahi Whai Ake
16.1 Following adoption of the IPN 2026, the website will be updated and
the IPN made available. Stakeholders will be informed of the update through
emails and sector newsletters.
|
1.⇩
|
Tasman
Inundation Practice Note 2026
|
73
|
|
2.⇩
|
Feedback
received, staff responses and recommended amendments to IPN
|
117
|
Strategy Finance and
Performance Committee Agenda – 19 March 2026

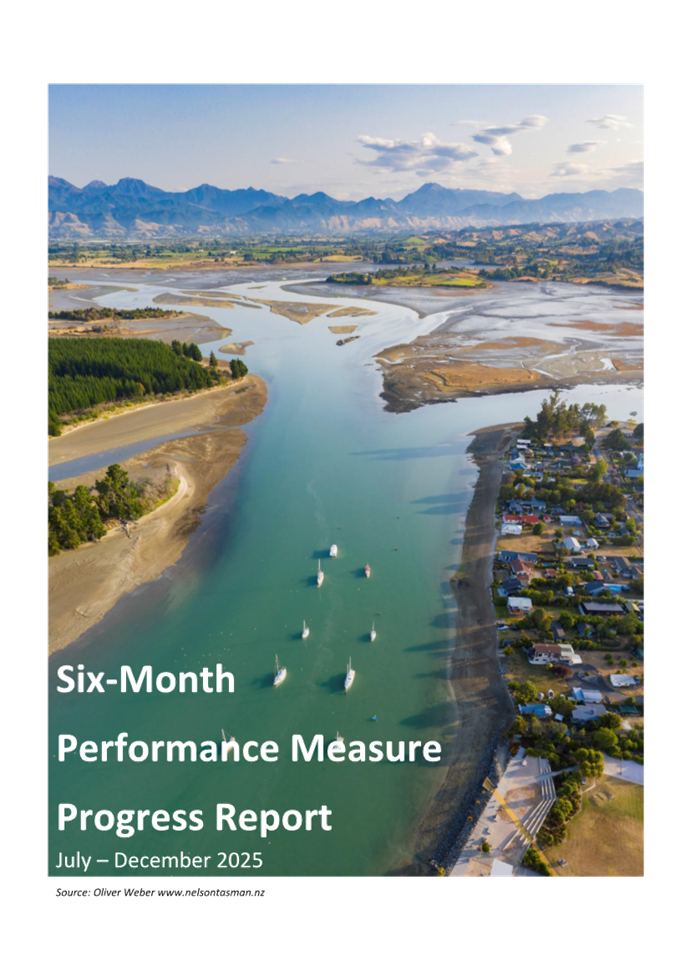
7.5 Six-Month Performance Measure Progress Report
2025/2026
Information Only - No Decision
Required
|
Report
To:
|
Strategy
Finance and Performance Committee
|
|
Meeting
Date:
|
19
March 2026
|
|
Report
Author:
|
Emily
Garland, Graduate Community Policy Advisor
|
|
Report
Authorisers:
|
Sue
McLean, Kaiwhakahaere ā Rōpū – Te Pae Rautaki Ahumoni |
Group Manager - Strategy & Finance
|
|
Report
Number:
|
RSFP26-03-3
|
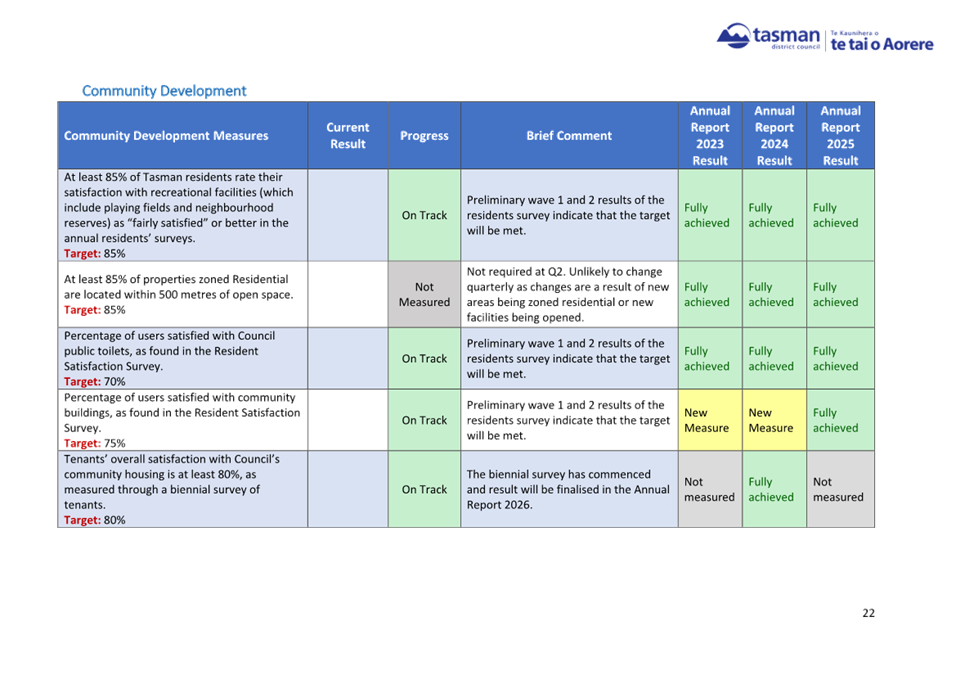
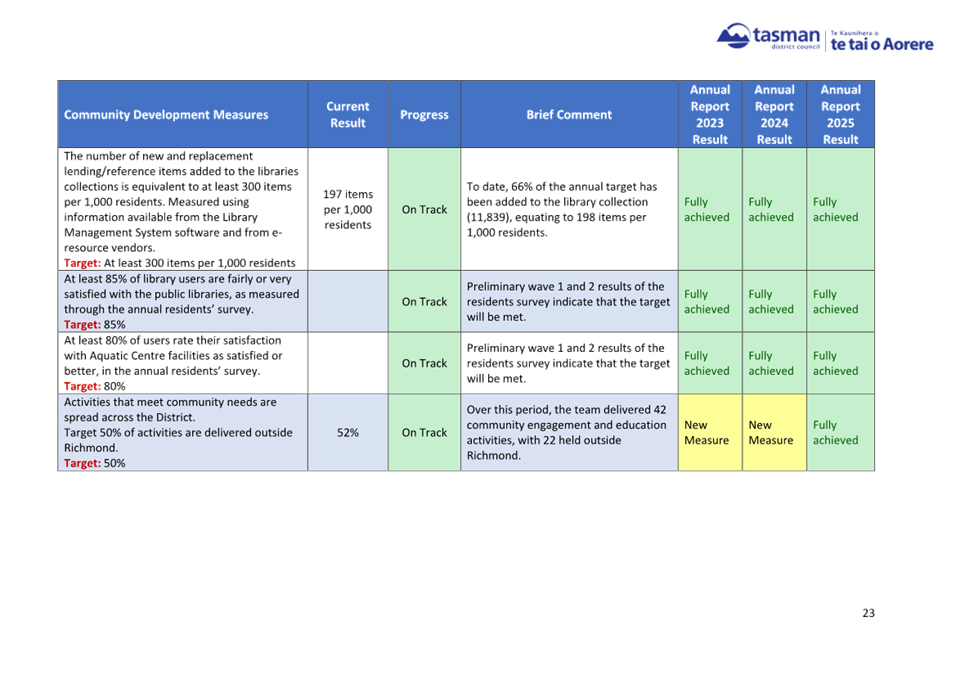
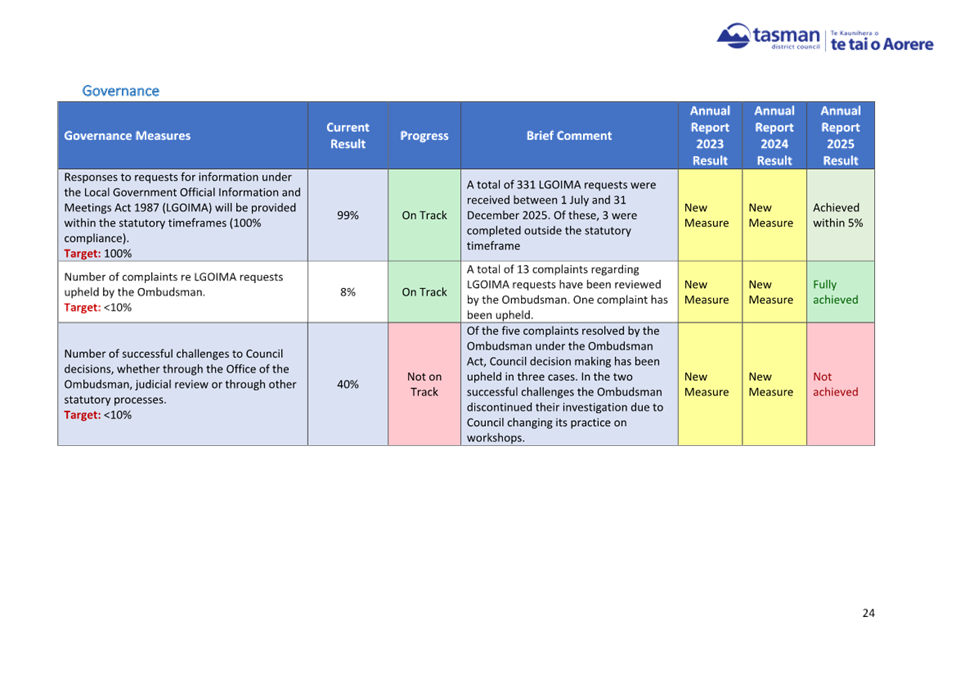
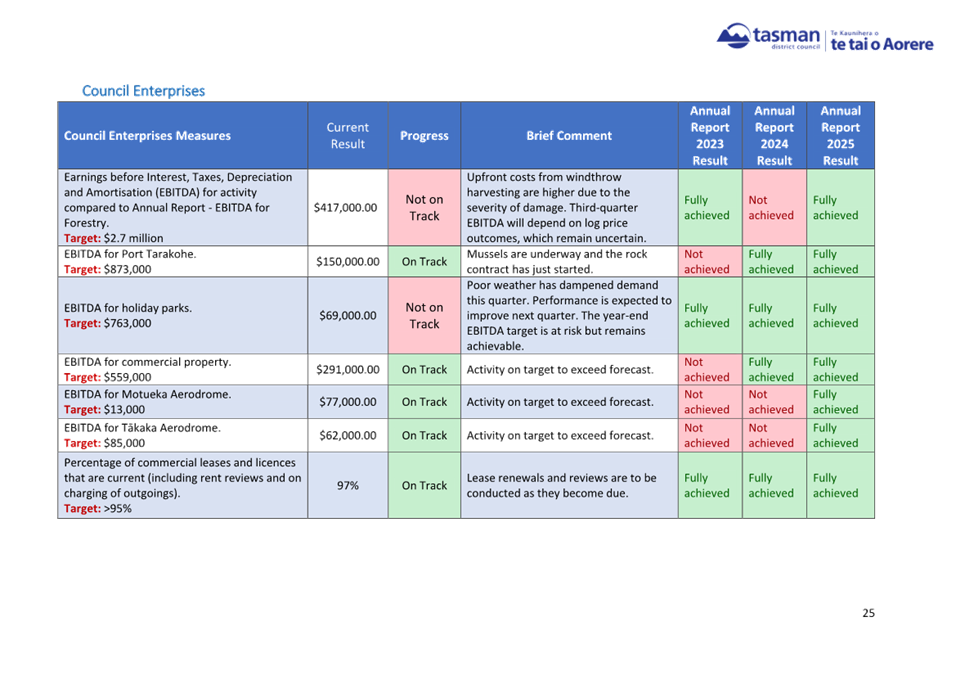
1. Summary
/ Te Tuhinga Whakarāpoto
1.1 This
report summarises the six-month progress (July to
December 2025) against the Levels of Service Performance Measures set in
Tasman’s 10-Year Plan 2024-2034 (LTP). The
Council measures its service performance each year using a core set of
indicators set in the LTP.
1.1 As this is the six-month progress,
results are indicative of the Council’s Performance Measure results only
for 2025/2026. The final results will be presented in the Annual Report
2025/2026, scheduled to be adopted in October 2026.
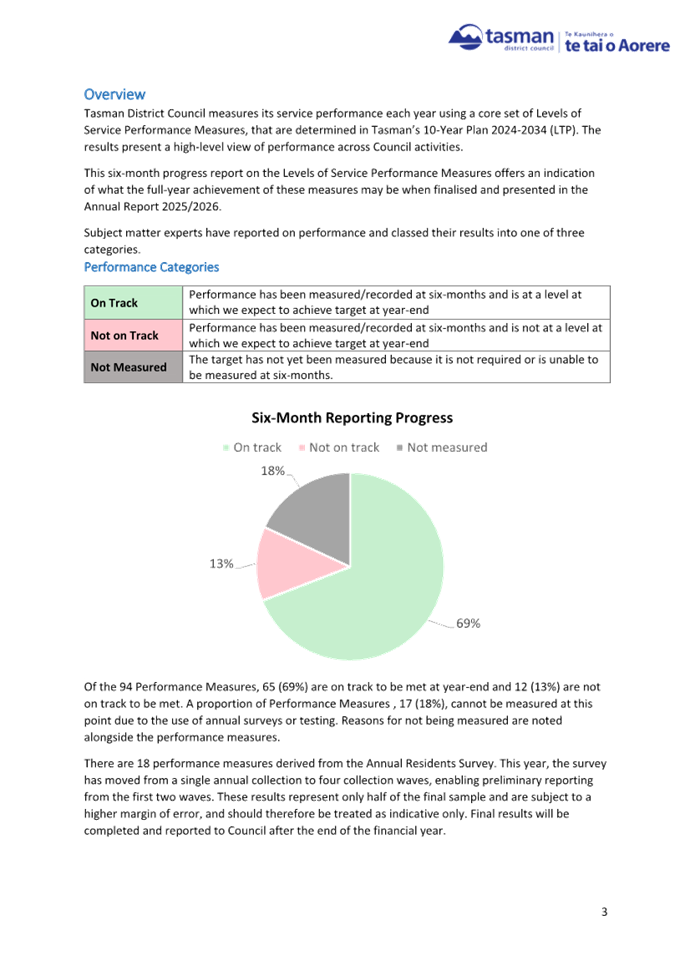
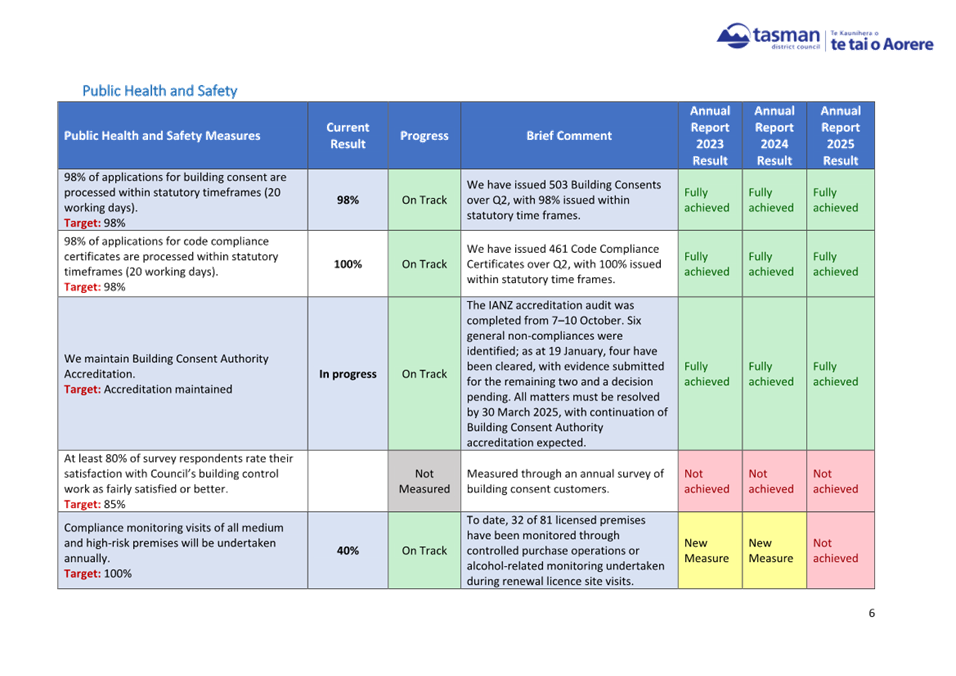
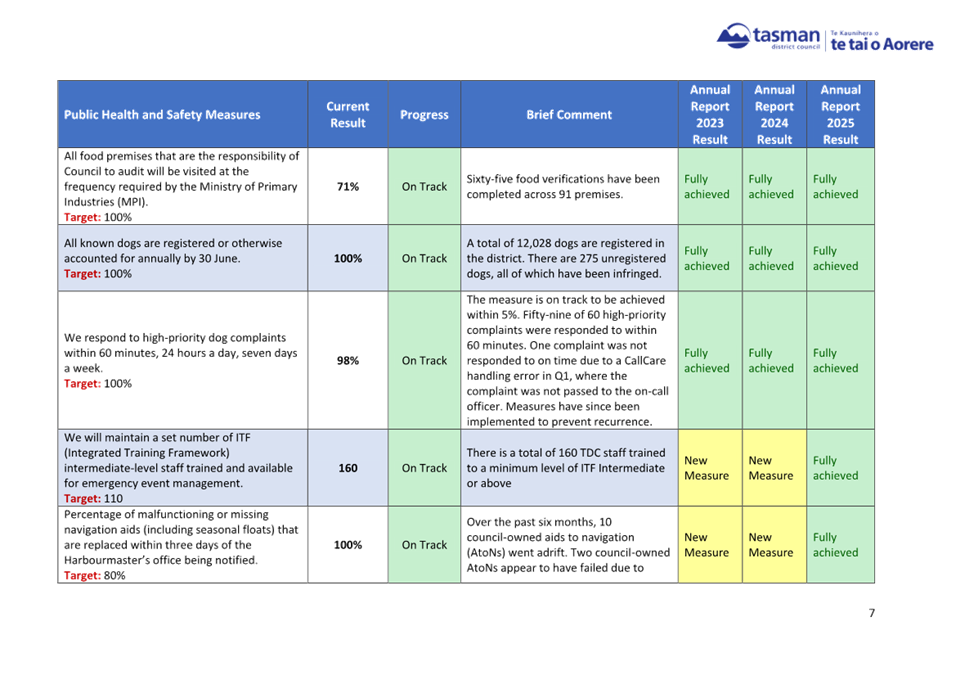
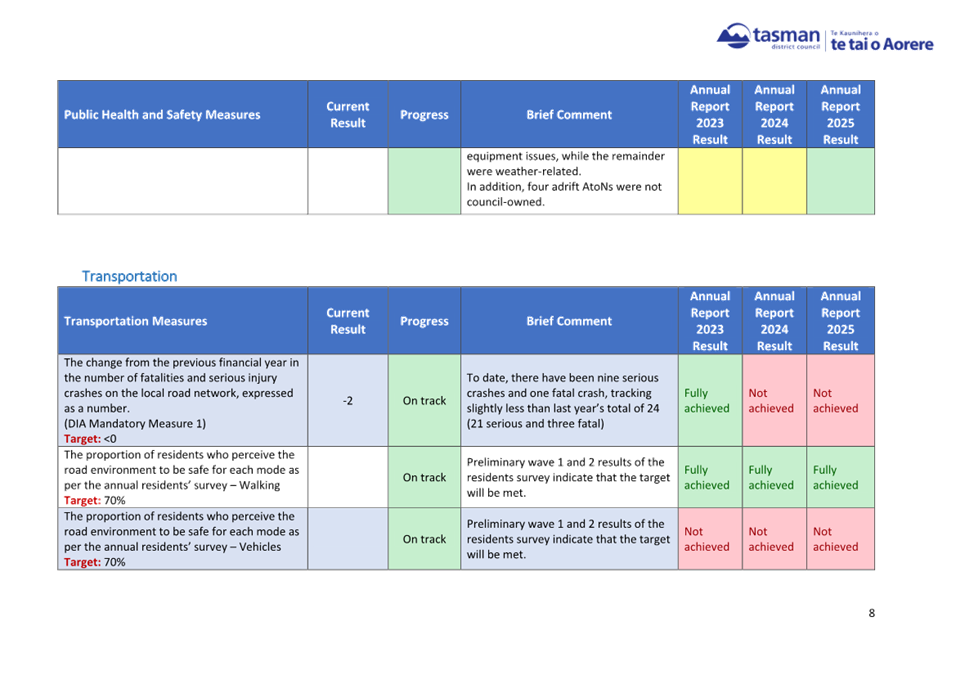
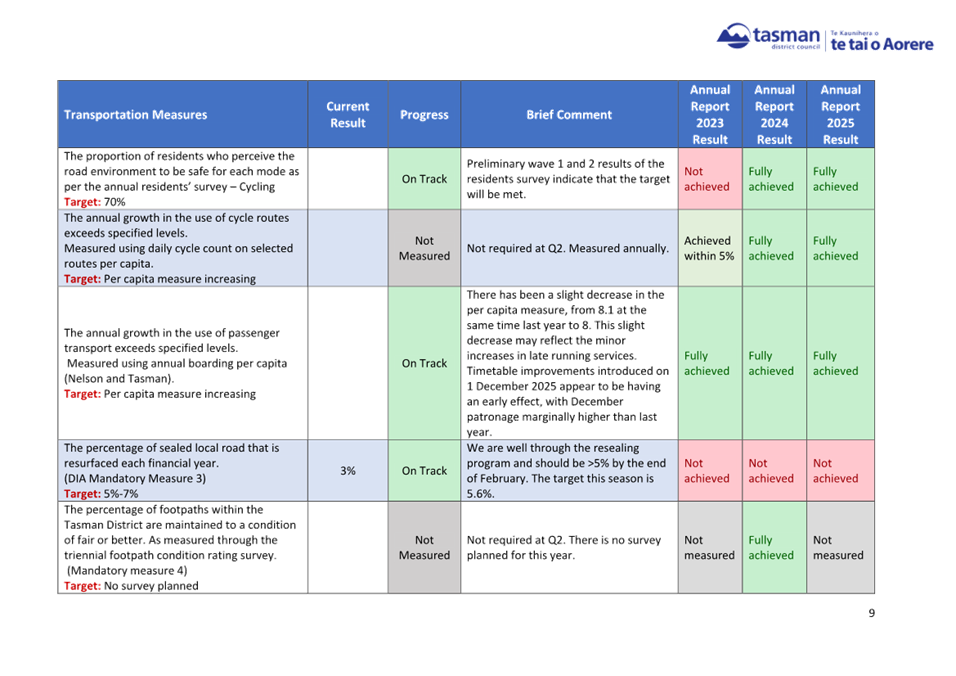
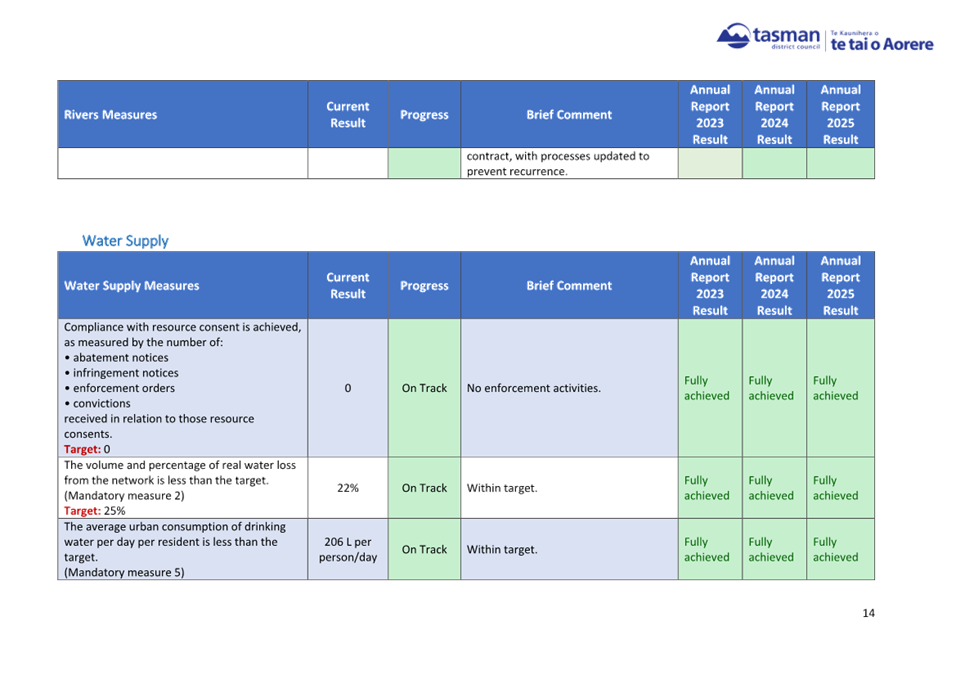
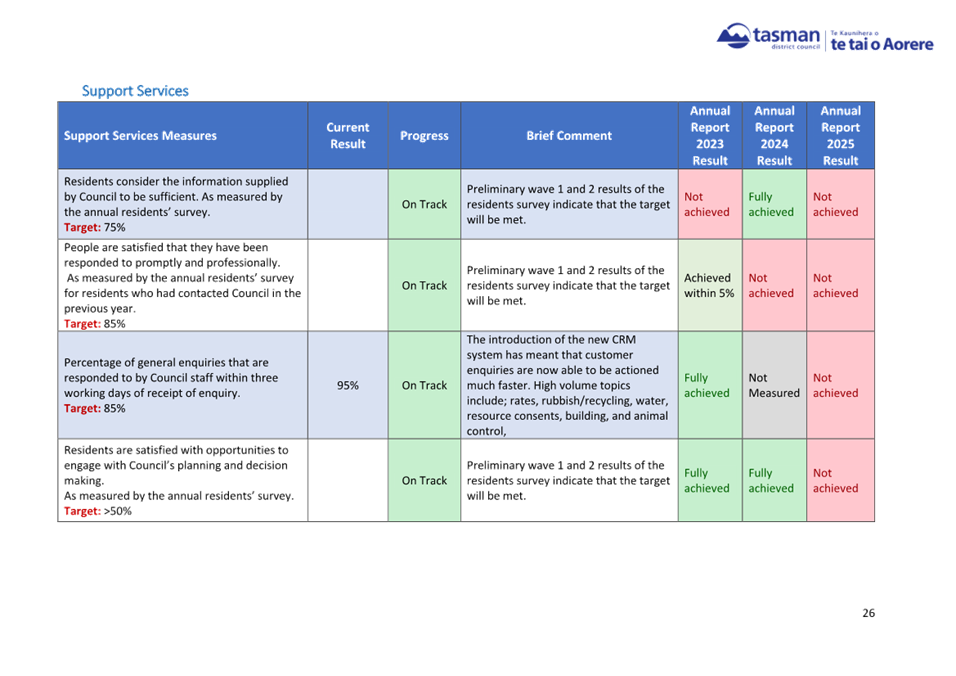
1.2 Of the 94 Performance Measures, 65 (69%)
are on track to be met by year end, and 12 (13%) are not on track to be met. A
proportion of Performance Measures, 17 (18%), cannot be measured at this point
due to the use of annual surveys or testing.
1.3 The full Progress Report is provided in Attachment
1.
2. Recommendation/s
/ Ngā Tūtohunga
That the Strategy Finance and Performance Committee
1. receives the Six-Month Performance Measure Progress Report
2025/2026 RSFP26-03-3.
3.1 Relevant
staff have reported on the progress in achieving their Performance Measure
targets, set in LTP 2024-2034.
3.2 Staff
were asked to classify performance in one of three categories:
3.2.1 On Track - Performance has been measured at six months
and is at a level where the target is expected to be achieved by year end.
3.2.2 Not on Track - Performance has been measured at six
months and is not at a level where the target is expected to be achieved by
year end.
3.2.3 Not Measured - The target has not yet been measured, as
it is either not required or cannot be measured at the six-month point.
3.3 As this is an interim report,
results are indicative only of Council’s Performance Measure outcomes for
2025/2026. Final results will be reported through the Annual Report 2025/2026,
scheduled for adoption in October 2026.
3.4 Of the 94 Performance Measures, 65 (69%)
are on track to be met and 12 (13%) are not on track at this point in the year.
A further 17 measures (18%) are unable to be measured at six months due to
their reliance on annual surveys[1]
or testing. These reasons are noted within the full Progress Report in Attachment
1.
3.5 The
12 measures that are currently not on track are primarily due to weather
impacts, resourcing pressures, and regulatory complexity. Staff are monitoring
these measures and intervening where possible.
3.6 
By comparison, of the 94 measures in the Annual Report
2024/2025, Council fully achieved or achieved within 5% a total of 70
Performance Measures (74%). Twenty‑two measures (23%) were
not achieved, and two were unable to be measured.
4. Measures
Not Meeting Target
4.1 Twelve Performance Measures are not on
track to be met. These are outlined in the following table by Group of
Activity:
|
Performance
Measure
|
Current
Result
|
Progress
|
Brief
Comment
|
AR 2025
Result[2]
|
|
Environmental
Management
|
|
Consent applications are
processed within statutory timeframes (where
they exist) - Non-notified consents
Target: 100%
|
71%
|
Not on Track
|
This is a slight decrease
from Q1 (79%), which was anticipated due to delays in allocating consents to
planners. Performance remains consistent with previous years, and the
appointment of two new senior planners in March is expected to improve
results going forward.
|
Not
achieved
|
|
Consent applications are
processed within statutory timeframes (where
they exist) - Limited notified consents
Target: 100%
|
0%
|
Not on Track
|
One limited‑notified
decision was issued in Q2 and was partly granted, with no appeals. Due to its
complexity and a two‑day hearing, the consent did not meet statutory
timeframes.
|
Not
achieved
|
|
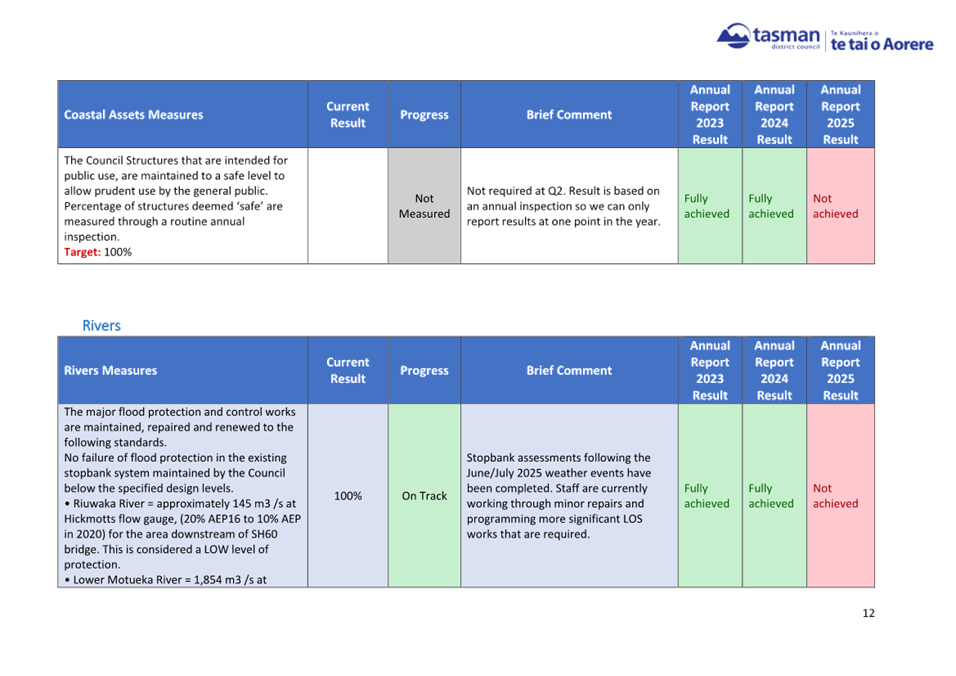
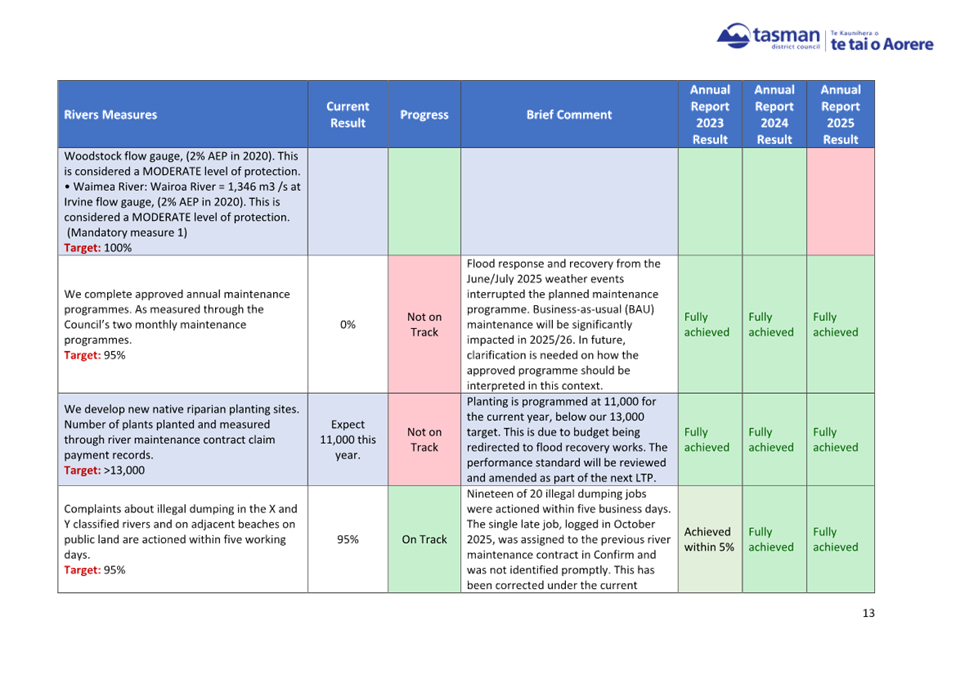
Rivers
|
|
We complete
approved annual maintenance programmes. As measured through the
Council’s two monthly maintenance programmes.
Target: 95%
|
0%
|
Not on Track
|
Flood
response and recovery from the June/July 2025 weather events disrupted the
planned maintenance programme, which will not be completed as scheduled.
Maintenance activity is now focused on recovery in affected areas. The annual
maintenance programme was completed in each of the previous three financial
years.
|
Fully
achieved
|
|
We develop
new native riparian planting sites. Number of plants planted and measured
through river maintenance contract claim payment records.
Target: >13,000
|
Expect 11,000
this year.
|
Not on Track
|
Planting is
programmed at 11,000 for the current year, below our 13,000 target. This is
due to budget being redirected to flood recovery works. The performance
standard will be reviewed and amended as part of the next LTP.
|
Fully
achieved
|
|
Water Supply
|
|
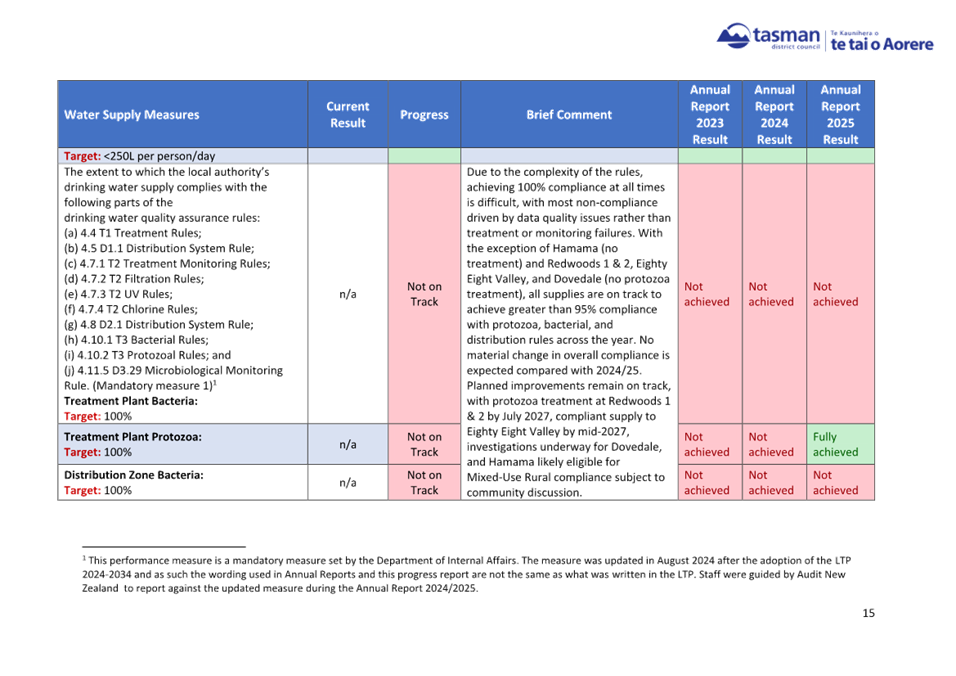
The extent to
which the local authority’s drinking water supply complies with the
following parts of the
drinking
water quality assurance rules:
(a) 4.4 T1
Treatment Rules;
(b) 4.5 D1.1
Distribution System Rule;
(c) 4.7.1 T2
Treatment Monitoring Rules;
(d) 4.7.2 T2
Filtration Rules;
(e) 4.7.3 T2
UV Rules;
(f) 4.7.4 T2
Chlorine Rules;
(g) 4.8 D2.1
Distribution System Rule;
(h) 4.10.1 T3
Bacterial Rules;
(i) 4.10.2 T3
Protozoal Rules; and
(j) 4.11.5
D3.29 Microbiological Monitoring Rule. (Mandatory measure 1)[3]
Treatment
Plant Bacteria:
Target: 100%
|
n/a
|
Not on Track
|
Due to the
complexity of the rules, achieving 100% compliance at all times is difficult,
with most non‑compliance driven by data quality issues rather than
treatment or monitoring failures. With the exception of Hamama (no treatment)
and Redwoods 1 & 2, Eighty Eight Valley, and Dovedale (no protozoa
treatment), all supplies are on track to achieve greater than 95% compliance
with protozoa, bacterial, and distribution rules across the year. No material
change in overall compliance is expected compared with 2024/25. Planned
improvements remain on track, with protozoa treatment at Redwoods 1 & 2
by July 2027, compliant supply to Eighty Eight Valley by mid‑2027,
investigations underway for Dovedale, and Hamama likely eligible for Mixed‑Use
Rural compliance subject to community discussion.
|
Not
achieved
|
|
Treatment
Plant Protozoa:
Target: 100%
|
n/a
|
Not on Track
|
Fully
achieved
|
|
Distribution
Zone Bacteria:
Target: 100%
|
n/a
|
Not on Track
|
Not
achieved
|
|
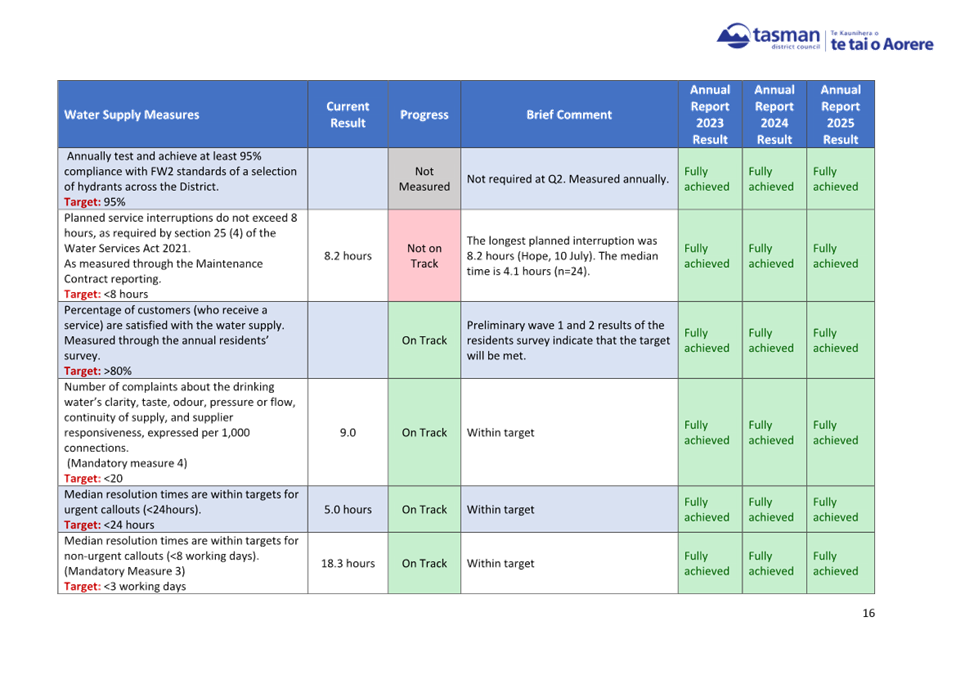
Planned
service interruptions do not exceed 8 hours, as required by section 25 (4) of
the Water Services Act 2021.
As measured through the Maintenance Contract reporting.
Target: <8 hours
|
8.2 hours
|
Not on Track
|
The longest
planned interruption was 8.2 hours (Hope, 10 July). The median time is 4.1
hours (n=24).
|
Fully
achieved
|
|
Waste
Management and Minimisation
|
|
The incidence of illegal
dumping does not increase over time. As measured by the number of reports of
illegal dumping per annum in parks, rivers and road reserve.
Target: Less than 100
|
77
|
Not on Track
|
Preliminary data for
July–December 2025 shows 77 incidents, including 10 carcass‑dumping
cases. This is consistent with the previous two years and indicates the
annual target is likely to be exceeded again this year. This time last year
there had been 112.
|
Not
achieved
|
|
Governance
|
|
Number of successful
challenges to Council decisions, whether through the Office of the Ombudsman,
judicial review or through other statutory processes.
Target: <10%
|
40%
|
Not on Track
|
Of the five complaints
resolved by the Ombudsman under the Ombudsman Act, Council decision making
has been upheld in three cases. In the two successful challenges the
Ombudsman discontinued their investigation due to Council changing its
practice on workshops.
|
Not
achieved
|
|
Council
Enterprises
|
|
Earnings
before Interest, Taxes, Depreciation and Amortisation (EBITDA) for activity
compared to Annual Report - EBITDA for Forestry.
Target: $2.7 million
|
$417,000
|
Not on Track
|
Upfront costs
from windthrow harvesting are higher due to the severity of damage. The third‑quarter
EBITDA will depend on log price outcomes, which remain uncertain.
|
Fully
achieved
|
|
EBITDA for
holiday parks.
Target: $763,000
|
$69,000
|
Not on Track
|
Poor weather
in the region has affected holiday park demand for the October-December
quarter. It is expected that the January-March quarter will improve but the
year-end EBITDA target remains at risk.
|
Fully
achieved
|
5.1 This
report outlines six‑month
progress (July–December 2025) against the Levels of Service Performance
Measures in Tasman’s 10‑Year
Plan 2024–2034.
5.2 Most
measures are on track to meet their targets, consistent with last year’s
performance. Approximately 18% of measures cannot be assessed at this time as
they rely on annual testing or surveys. Twelve measures are not on track due to
weather impacts, resourcing pressures, and regulatory complexity.
5.3 As
an interim report, results are indicative only. Final performance outcomes for
2025/2026 will be confirmed through the Annual Report, scheduled for adoption
in October 2026.
|
1.⇩
|
2025/2026
Six-Month Performance Measure Progress Report
|
137
|
7.6 Chair's Report
Information Only - No Decision
Required
|
Report
To:
|
Strategy
Finance and Performance Committee
|
|
Meeting
Date:
|
19
March 2026
|
|
Report
Author:
|
Kit
Maling, Councillor
|
|
Report
Authorisers:
|
Sue
McLean, Kaiwhakahaere ā Rōpū – Te Pae Rautaki Ahumoni |
Group Manager - Strategy & Finance
|
|
Report
Number:
|
RSFP26-03-8
|
1. Summary
/ Te Tuhinga Whakarāpoto
1.1 This is the
Chair’s report to the Strategy, Finance and Performance Committee.
2. Recommendation/s
/ Ngā Tūtohunga
That the Strategy Finance and Performance Committee
1. receives
the Chair's Report report RSFP26-03-8.
3.1 Welcome to this Strategy Finance and
Performance Committee meeting, being our second standing committee meeting of
the triennium. This report will be particularly brief.
4. National Direction Updates
4.1 I encourage all
members to read and print off the national direction updates that our Resource
Consents Manager, Katrina Lee, supplied to us on 2 March, which summarises new
national direction documents, new national policy statements and amendments to
national policy statements. These came into effect in January and give a
consistent national direction from central government.
4.2 Also, infrastructure and resilience has
a greater focus and balanced growth.
Nil
Strategy Finance and
Performance Committee Agenda – 19 March 2026
8 CONFIDENTIAL SESSION
8.1 Procedural
motion to exclude the public
The following
motion is submitted for consideration:
That the
public be excluded from the following part(s) of the proceedings of this
meeting. The general subject of each matter to be considered while the public
is excluded, the reason for passing this resolution in relation to each matter,
and the specific grounds under section 48(1) of the Local Government Official
Information and Meetings Act 1987 for the passing of this resolution follows.
This resolution is made in reliance on section 48(1)(a) of the Local
Government Official Information and Meetings Act 1987 and the particular
interest or interests protected by section 6 or section 7 of that Act which
would be prejudiced by the holding of the whole or relevant part of the
proceedings of the meeting in public, as follows:
8.2 Community Occupancy Policy - Financial
implications
|
Reason for passing this resolution in
relation to each matter
|
Particular interest(s) protected (where
applicable)
|
Ground(s) under section 48(1) for the
passing of this resolution
|
|
The public conduct of the part of the
meeting would be likely to result in the disclosure of information for which
good reason for withholding exists under section 7.
|
s7(2)(i) - The withholding of the
information is necessary to enable the local authority to carry on, without
prejudice or disadvantage, negotiations (including commercial and industrial
negotiations).
|
s48(1)(a)
The public conduct of the part of the
meeting would be likely to result in the disclosure of information for which
good reason for withholding exists under section 7.
|