Tasman District
Council
Agenda – 07 November 2024
5 Reports
5.1
Quarterly Financial
Report
Information Only - No Decision
Required
|
Report
To:
|
Tasman
District Council
|
|
Meeting
Date:
|
7
November 2024
|
|
Report
Author:
|
Paul
Egan, Management Accounting Manager
|
|
Report
Authorisers:
|
Mike
Drummond, Chief Financial Officer
|
|
Report
Number:
|
RCN24-11-1
|
1. Summary
/ Te Tuhinga Whakarāpoto
1.1 This three-monthly
financial report provides an update on key financial information as at the end
of September 2024.
1.2 This report updates actual revenues, expenditure, and the financial
position for year to date, 30 September 2024.
1.3 In the three months to September 2024,
material financial pressures on the Council for this financial year are
becoming clear. The tight budgeting included in the 2024-34 Long Term plan
carried a higher risk of adverse variances as it limited any discretionary
spending that could be sacrificed to ensure the overall financial performance
remained within budget.
1.4 While a full reforecast has not been
able to be undertaken due to constraints with resourcing and reporting on the
prior financial year, trends have been identified to bring to the
Council’s attention.
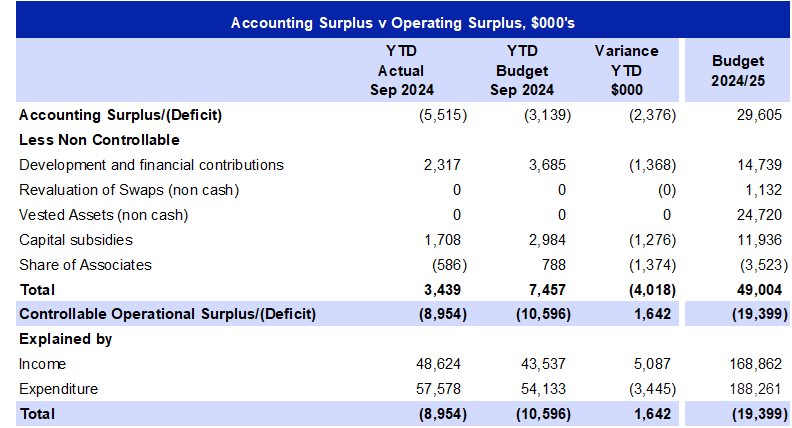
1.5 The year-to-date operating deficit on
the statement of comprehensive financial performance is $2.4 million worse than
expected at this point. The controllable deficit is $1.6 million
favourable to budget year to date September 2024.
1.6 Financial pressures are coming from
macro level factors that impact the whole organisation, and issues in
particular areas. These pressures are elaborated upon in sections six and
seven.
1.7 Treasury Policy Net debt at 30
September was $261.7 million, compared to the target of $279.7 million at June
2025.
1.8 Capital expenditure excluding Joint
Ventures is $16.4 million; 21% of revised full year budget of $80.5
million.
1.9 Some expenditure, especially insurance
and rates occurs and is budgeted for mainly in the first quarter of the
financial year.
1.10 Table 1 below provides a
reconciliation of the accounting result compared to the operational position.
The operational position strips out non-cash items and items that can only be
used to fund capital expenditure e.g. swap revaluations, vested assets, and
capital subsidies. This is then a proxy for running a balanced budget where
operational expenditure is covered by operational income.
Table 1
2. Recommendation/s
/ Ngā Tūtohunga
That the Tasman
District Council
1. receives
the Quarterly Financial Report for the three months to 30 September 2024; and
2. notes
that there are significant cost pressures on the Council this financial year,
and that Council staff are working on a mitigation plan for this, and the
2025/26 financial year.
3. Background and Discussion
3.1 This is the first
financial report for the 2024/2025 financial year and covers financial
performance for the three months to 30 September 2024.
3.2 Controllable
operating income for September 2024 YTD is $48.6 million. This is a YTD
favourable variance of $5 million against a September 2024 YTD budget of $43.5
million. Receipt of the Infrastructure Holdings Limited (IHL) dividend which
was declared too late for inclusion in the 2023/24 financial year results, and
higher Operating Subsidies are the key drivers.
3.3 Controllable operating expenditure for
September 2024 YTD is $57.6 million. This is an unfavourable variance of $3.4
million on the September 2024 YTD budget of $54.1 million.
3.4 There are considerable financial
pressures that will be discussed in Sections seven and eight.
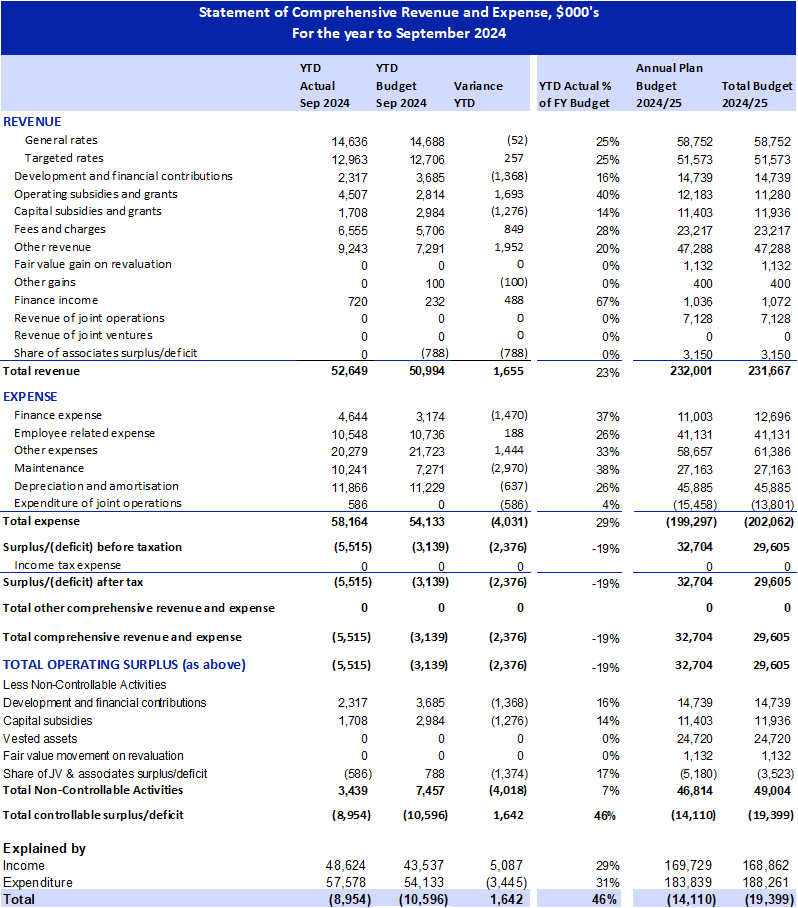
4. Statement of Comprehensive Revenue and
Expense
Table 2
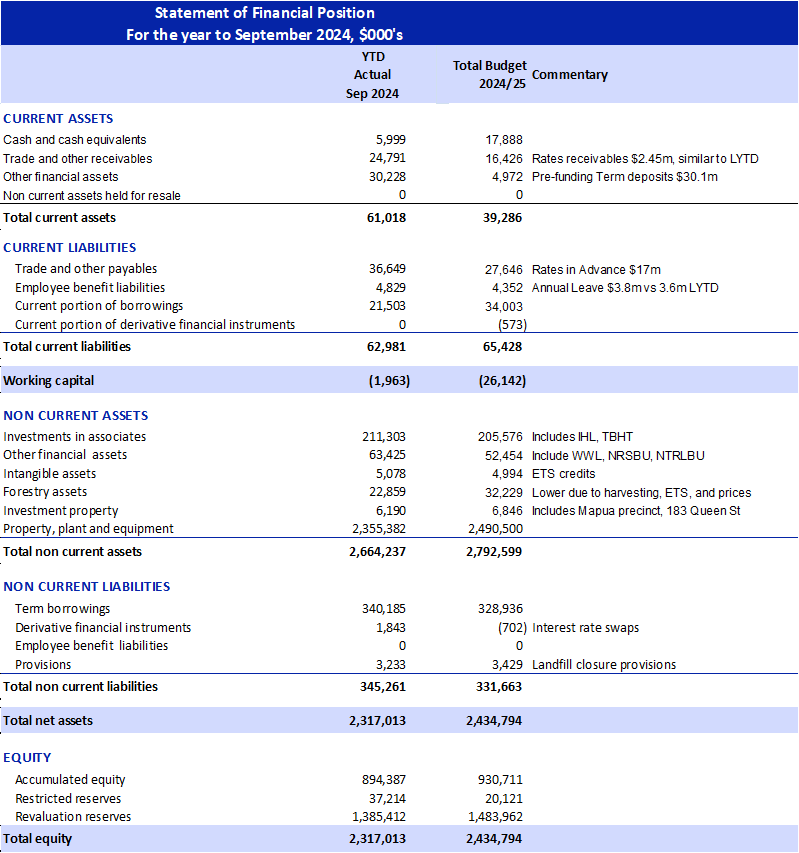
5. Statement of Financial Position
Table 3
6.1 The Council is facing
several significant financial pressures that are a result of both macroeconomic
and others, particular to the Council.
6.2 Net finance expenses (interest costs) are
$982,000 over budget for the quarter, 34% of the full year budget. If this
continues then Net Finance expenses are likely to be approximately
$3.1 million over budget for the year. Part of this is influenced by
declines in interest rates being less, and later than expected. Work is
continuing with our Treasury Advisors, PWC, to understand the drivers of the
variance.
6.3 Sector inflation has been higher for
some items than allowed for in the budget modelling assumptions. Accepted
practice has been to use inflation rates obtained from an economic consultancy
that provides a specialist set of inflation rates for local
government. These have not been sufficient for some categories of cost,
especially maintenance and operations contracting costs.
6.4 Insurance costs are higher this year,
and while not all costs have been advised yet, they are expected to be
approximately 17% higher this year, drivers include the increasing value of the
assets and difficulties obtaining full cover for public liability and
professional indemnity.
6.5 Maintenance costs are tracking at 38%
of full year budget 25% of the way into the year. This is a result of a
combination of some seasonal work that occurred predominately in the first
quarter but is mainly due to insufficient budget to cover higher cost
escalations, and growth. Additionally, some items were inadvertently
reduced/removed in the budget prioritisation process. New Zealand
Transport Agency (NZTA) funding notified August 2024 is less than the LTP
budget which was approved in June 2024.
Transportation
7.1 As mentioned above,
transportation is impacted by higher maintenance costs than budgeted together
with lower NZTA funding. Additionally, insufficient allowance was made for some
items through the budget prioritisation process, which will necessitate further
prioritisation this year.
7.2 The major cost pressure in this area year to
date is maintenance which is tracking at 35.6% for full year budget 25% of the
way through the year – some of this is seasonal, some has other
causes.
7.3 Routine Drainage Maintenance is at 53%
of full year budget – mostly programmed early in the year, this work will
drop back and is expected to end the year on budget.
7.4 General Road Maintenance works at 32%
of full year budget have been a programme focus early in the year and are
expected to end the year on budget.
7.5 Environmental Maintenance including
landslips and protecting against them is at 44% of full year budget. Current
management estimates expect this budget to be overspent at year end.
7.6 Inflation related pressures lead to
contract escalations for maintenance and operations contracts being higher than
allowed for in the budget.
7.7 Insufficient allowance was made in this
year’s budget for several items including:
7.7.1 Database and Asset Management is 130% over full
year budget in the first quarter but will be offset by under-expenditure
elsewhere.
7.7.2 Landscape maintenance was under budgeted by
$150,000 for the full year.
7.7.3 Street cleaning and litter bin servicing costs
were under budgeted $230,000.
7.8 NZTA funding budgets for Tasman
District Council determined by NZTA in August 2024, were less than budgeted in
the LTP by $716,000. This was presented to the Council at the meeting on
24 October 2024, with direction that the locally funded share of expenditure
budgeted can continue, but the portion of expenditure not funded by NZTA should
not occur.
7.9 Responses being considered to higher
than budgeted maintenance costs are to:
7.9.1 Revise the growth in asset network to be included
in 2025/26 annual plan.
7.9.2 Revise the timing of contractual escalations to
better align with budget approval timing.
7.9.3 Prioritise work and expenditure commitments where contractual
flexibility allow.
Water Supply
7.10 The major cost pressure in this area year to date is
maintenance expense which is tracking at 39% for full year budget 25% of the
way through the year. Routine maintenance costs, in particular sampling
and monitoring, were not fully funded and a deliberate decision was made to
reduce reactive maintenance budgets to reduce rates. Other Operations’
expenses had issues, but not to the same extent.
7.11 Some of these pressures are seasonal, with work
being undertaken early in the financial year, some are inflation related, and
some are where insufficient allowance was made in the budget. Through the
Council LTP process some budgets especially in reactive maintenance were
reduced. This position carried with it an element of risk in being able to stay
within budget.
7.12 Impacted areas (excluding Waimea Community Dam) related
costs include:
7.12.1 Reactive Maintenance at
39% of full year budget – there is a higher incidence of this in the
winter months and is expected to end the year on budget. Pipe failures
– asbestos cement and “blue brute” PVC pipes continue to be high
due to a lagging renewal programme. New requirements to comply with the
water regulator Taumata Arowai standards are leading to an increase in reactive
work for water quality issues and reservoirs.
7.12.2 Routine Maintenance works
at 41% of full year budget have not been sufficiently allowed for in the budget
and are expected to end the year approximately $400,000 over budget. A
significant part of these unbudgeted costs is for mandatory sampling and monitoring
to meet the new drinking water standards.
7.12.3 The Drinking Water
Quality Assurance Rules 2022 were implemented from
1 January 2023. These replaced the previous Drinking Water Standards for New
Zealand. The Rules introduced a range of increased minimum monitoring
requirements and at the same time, the Water Services Act (replacing the Health
Act) has elevated the expectations on water suppliers to manage risk. The
combined result has been the need to increase monitoring and risk management
effort.
7.13 Inflation related pressures lead to contract escalations
for maintenance and operations contracts being higher than allowed for in the
budget. The work programme, total out-turn costs, and rate escalations are
agreed with the alliance contractor after the budgets are set.
7.14 Insufficient allowance was made in this year’s
budget for a number of items including:
7.14.1 Reactive maintenance –
reticulation (water leaks), treatment plant (aeration towers) and reservoirs,
however the reservoirs cost ($25,000) were a once off to remove trees
threatening to fall onto the Stagecoach Rd reservoirs.
7.14.2 Routine maintenance -
reticulation - sampling of network around $400,000, sampling to new standards
for treatment plants and reservoirs.
7.15 Responses being considered to higher than budgeted
maintenance costs are to:
7.15.1 Revise the growth in asset
network to be included in 2025/26 annual plan.
7.15.2 Revise the timing of
contractual escalations to better align with budget approval timing.
7.15.3 Prioritise work and expenditure
commitments where contractual flexibility allows.
7.15.4 The Council to approve
reductions to levels of service to cut costs. The Council needs to be specific
as to what routine maintenance activities will be cut to reduce costs with the
understanding that this will lead to non-compliance and possibly prosecutions
and fines. Under the new legislation there is a personal liability for
non-compliance and contamination events.
Wastewater
7.16 Wastewater is a District-wide activity. The major cost pressure in
this area year to date is maintenance expense which is tracking at 32% for full
year budget 25% of the way through the year. Other Operations expenses
are tracking on budget YTD.
7.17 Some of these pressures are inflation related, and some are where
insufficient allowance was made in the budget due to the risk position the
Council took in accepting a reduction in reactive maintenance budgets.
7.18 Impacted areas costs include:
7.18.1 Reactive Maintenance at 28% of full year budget
7.18.2 Routine Maintenance works at 34% of full year budget have not been
sufficiently allowed for in the budget.
7.19 Routine
maintenance work has had a year to date spend of $364,000 versus a budget of
$183,000 an overspend of $116,000.
7.19.1 Of that overspend, $83,000 has been related to the Tākaka
Wastewater Treatment Plant (WWTP), servicing pumps and replacing filter
fabrics.
7.19.2 Other areas
of extra cost include higher sampling in Tākaka and maintaining the Motueka
WWTP, in particular the membrane filtration.
Waste Management and Minimisation
7.20 Waste
Management and Waste Minimisation are District-wide activities, each operating
as closed accounts. Waste management is largely funded by fees and charges,
local disposal levy from the landfill business unit and a smaller amount of
general rate. Waste Minimisation is fully funded by the New Zealand Waste
Disposal Levy.
7.21 The
Kerbside activity provides recycling, and user pays rubbish collection services
to 80% of properties in the District. The activity is funded by a targeted
rate.
7.22 The
major cost pressure in the Waste Management area year to date is operations and
routine and reactive maintenance expenses, which are tracking 12% above budget.
Landfill disposal and transport expenses are significantly below budget (70% of
budget), but these expenses are accompanied by lower income, particularly at
Richmond (57% of budget), with a net adverse variance. Illegal dumping activity
is also tracking significantly above budget.
7.23 Waste
Minimisation is tracking favourably against budget. Income from the New Zealand
Waste Disposal Levy is tracking above forecast and net expenses are tracking
below or on budget.
7.24 Expenses
in the Kerbside recycling and rubbish collection activity are tracking 20%
above budget, driven by contractual costs growing greater than inflation,
property growth greater than forecast and an error in budgeting for operation
of the Materials Recovery Facility (MRF).
Reserves and Facilities
7.25 The Reserves area encompasses Parks and Reserves, Community Housing,
Community Facilities, and Special Purposes Committees.
7.26 The major cost pressure in this area is maintenance expenses,
particularly in Parks and Reserves and Community Facilities. Other
expenses in these areas are tracking materially in line with budget.
7.27 Parks and Reserves has growth in the number of assets being
maintained in the District, combined with rising cost inflation pressures on
contractors that are passed through to the Council. These exceed the growth
allowances made in the budget, with the quantum of contractual cost rate
escalations not being confirmed until after the budget was approved.
7.28 Parks and Reserves maintenance expenditure is currently $220,000
over YTD budget, 28% of full year expenditure. While there are some seasonal
factors as to when work is done, such as turf renovations, maintenance
expenditure is expected to end the financial year over budget by approximately
$440,000.
7.29 Community Facilities maintenance expenditure is also higher than
expected at 36% of full year budget, $271,000 over budget. This is expected to
be over budget by this amount at year end.
7.30 Both Parks and Reserves and Community Facilities have significant
rates and insurance costs early in the year forming a significant amount of
their annual Other Expenditure.
7.31 Responses being considered to higher than budgeted maintenance costs
are to:
7.31.1 Revise the growth in asset network to be included in 2025/26 annual
plan.
7.31.2 Revise the timing of contractual escalations to better align with
budget approval timing.
7.31.3 Prioritise work and expenditure commitments where contractual
flexibility allows.
Building
Assurance
7.32 Building Assurance activities ran at a deficit last financial year
with the drop in new dwelling building consent applications contributing to a
revenue drop that left the activity underfunded.
7.33 This September year to date the activity is in surplus, and if this
continues will have it on track to navigate the lower revenue holiday period,
make sufficient surplus to recover the budgeted portion of last year’s
deficit and finish on budget overall.
7.34 Reasons for this are an increase in volumes in the first quarter,
the increase to fees and charges, and changes to the level of staffing in the
activity.
7.35 New dwelling building consent applications (excluding amendments)
are 78 for the YTD September, versus 59 for the same period last year
Service and Strategy
7.36 Services and Strategy have an unfavourable variance of $114,000 YTD
September in employee expenditure - due to higher than budgeted role occupancy.
7.37 The major expenditure item budgeted in Services and Strategy this
year is the potential grant funding for the regional Museum storage facility.
This is loan funded and including the $1.032 million carry over from last year,
has a full year budget of $3.172 million.
Information Services
7.38 Information Services is at 28.5% of its Other Expenses full year
budget. This is due to licencing fees expense for several core applications
that are paid annually falling in the first quarter. Digital Innovation
Programme costs are ramping up as the CRM project progresses – this
expenditure is deemed operating expenditure under current financial reporting
standards, and is loan funded. If the current level of DIP expenditure
continues this expenditure will end the year over-budget, a turning point from
prior years where there was a carry forward of unexpended budget.
8.1 Treasury
Policy Net Debt is $261.7 million as at 30 September 2024, compared to a
full-year budget of $279.7million. The increase from an opening Net Debt of
$247.8 million is due to the funding of capital expenditure during the first
three months of the year. The quarterly rates’ take impacts on cash flow
movements and, therefore, Net Debt. (Net Debt is gross debt less cash on hand
and other liquid financial assets).
8.1.1 Opening Net Debt 1 July 2024 $247.8 million
8.1.2 Net Debt 30 September 2024 $261.7 million
8.1.3 Net Debt June 2025 per 2024/25 Annual Plan $279.7 million
9. Capital Expenditure Analysis
Table 4
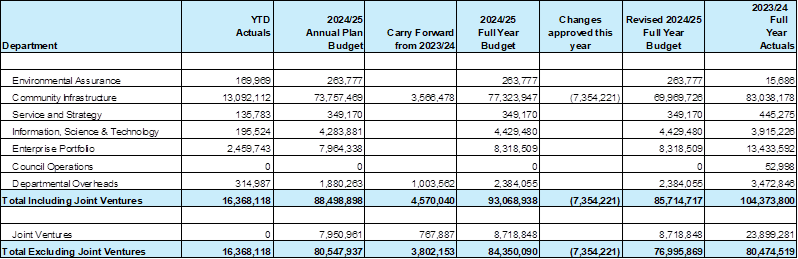
9.1 Overall, capital expenditure (including approved changes) is
tracking at 19% of revised full year budget including Joint Ventures. Excluding
Joint Ventures on a similar straight-line basis, the programme is tracking at
21% of revised full year budget.
Figure 1
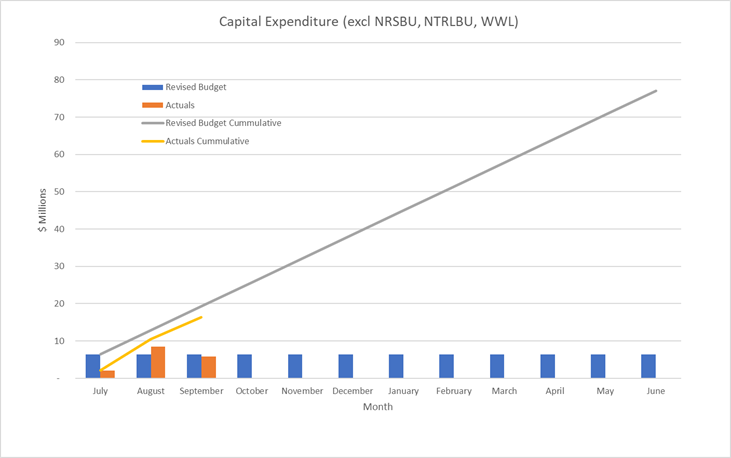
9.2 At its meeting on 24 October 2024, the
Council approved some changes to timing of capital expenditure in the Long-Term-Plan.
These were that $6.2 million of expenditure in future years of the
Long-Term-Plan was approved to be brought forward into the 2024/25 financial
year, while at the same time pushing out $13.6 million from 2024/25 to future
years. These changes are reflected in the revised budget in Table 4 above.
Nil